Industrial Breakdown - Revenue I. 2019, US

3
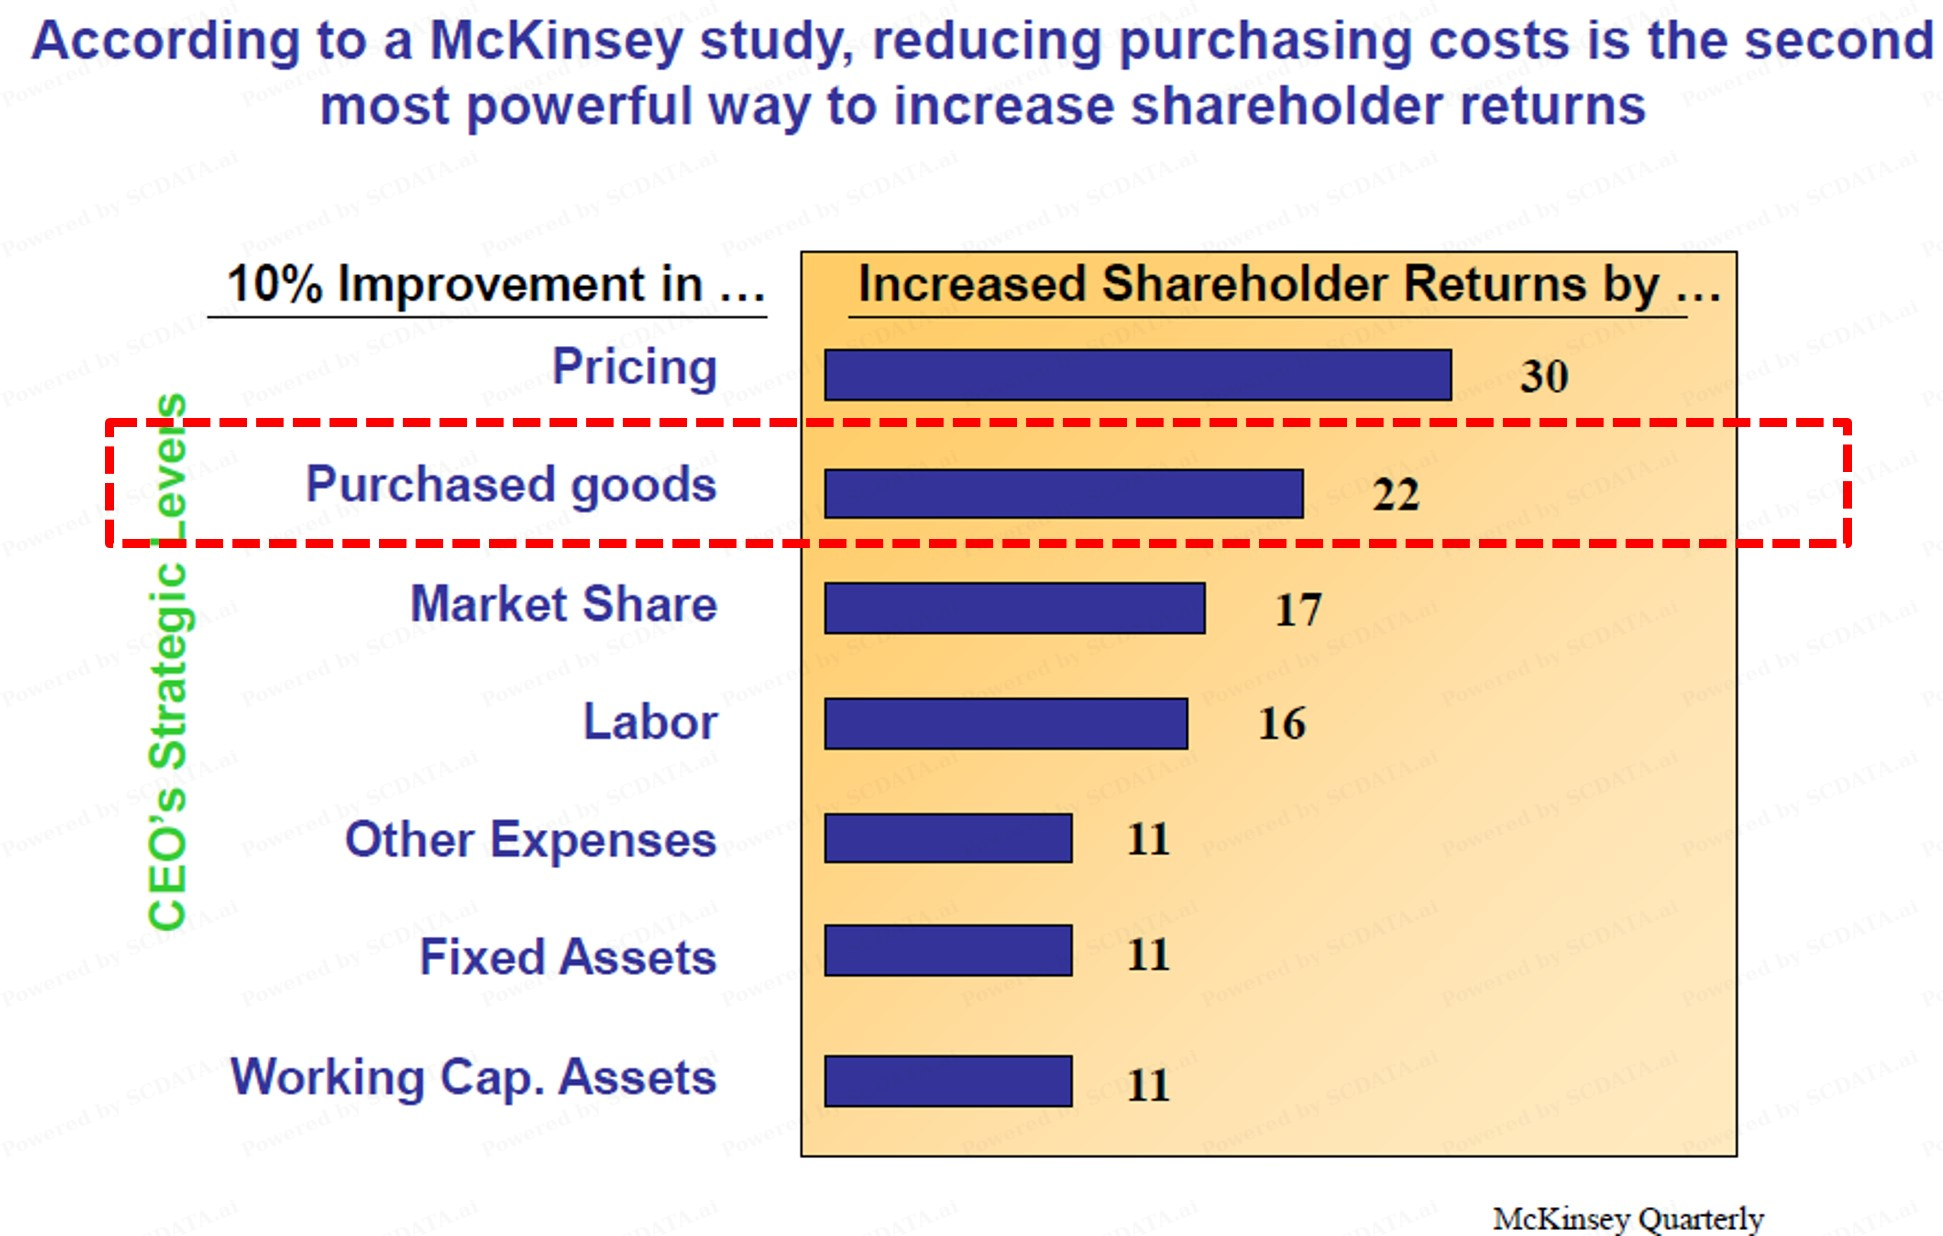
To see the cost significance of sourcing, let’s look at the data of COGS which typically include purchasing cost of raw materials and manufacturing cost. Data of the publicly traded companies in the US shows that in 2019, the energy sector has the highest COGS as a % of the revenue at about 81%, this is followed by materials at 76%, industrials at 74%, consumer staples at 73%, and so on.
3/13
Industrial Breakdown - Revenue II. 2019, US

4
In fact, except for financials, all other sectors have a COGS as the biggest cost component ~ > 40% of revenue. Because the purchasing cost is often much greater than the mfg cost (as we explained earlier), this data indicates the vital importance of cost control in sourcing.
4/13
Industrial Breakdown - Revenue. US vs. China I: Healthcare, IT, Real Estate

6
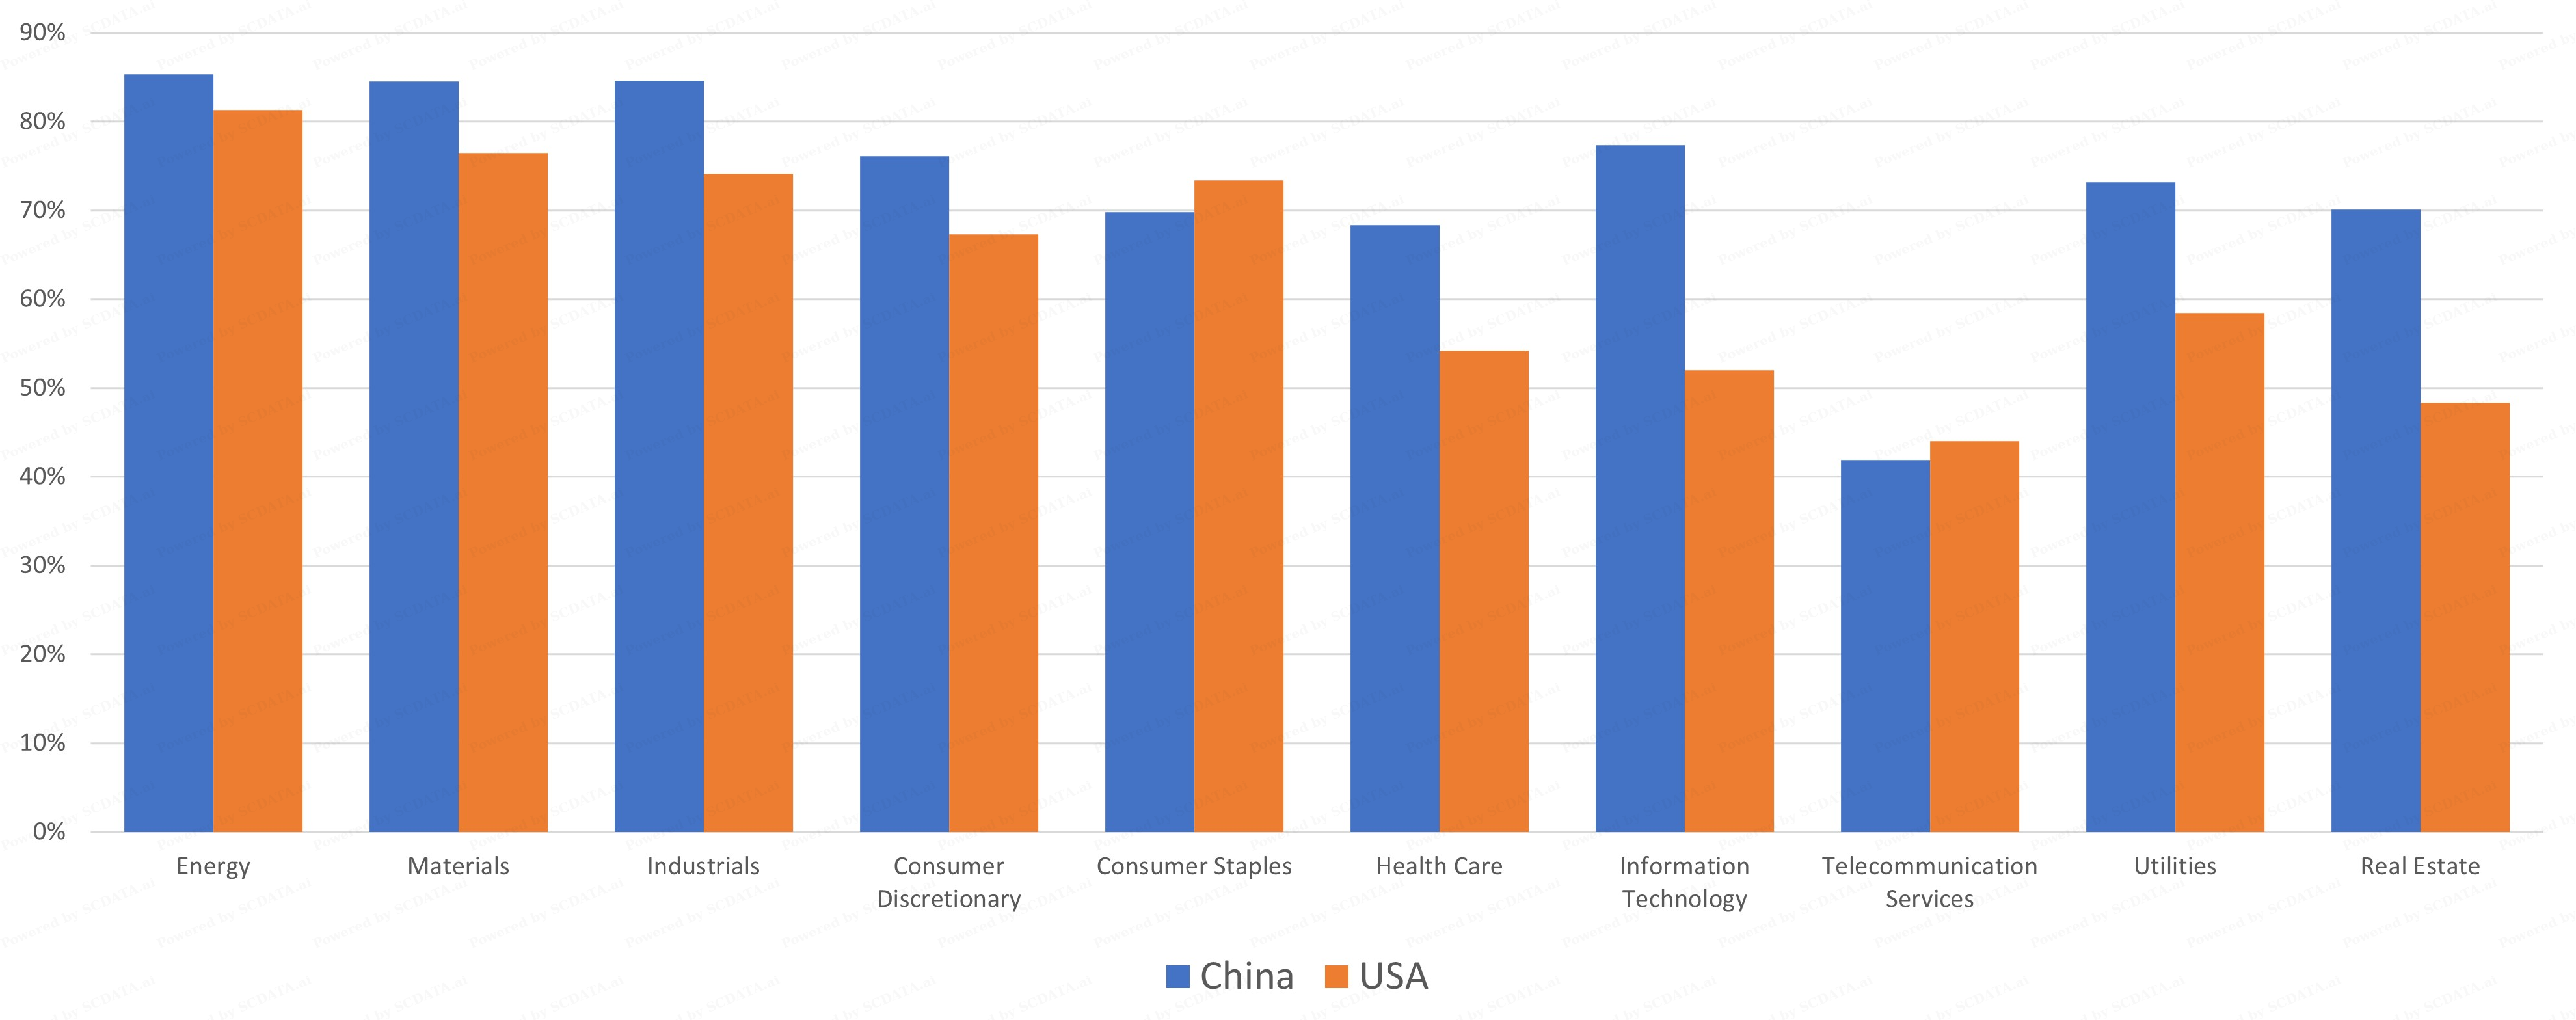
Looking closely at IT and health care sectors, the COGS light sectors, China COGS / revenue ~ 70% vs. US COGS / revenue ~ 50%. US spent quite sizably on R&D in Health care and IT, but China didn't.
6/13
Industrial Breakdown - Revenue: IT

7
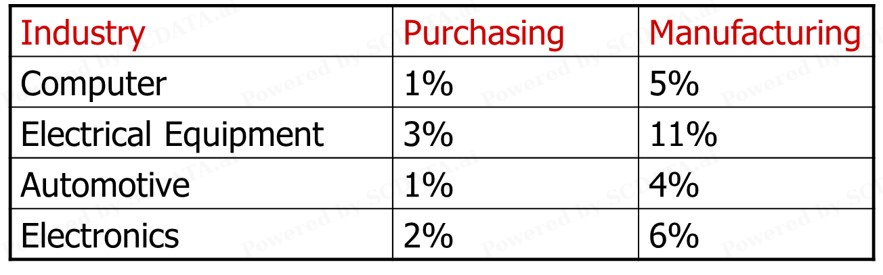
Zoom into IT industry, China COGS / revenue @ IT 2x US COGS / revenue @ IT, both software and semiconductor.
7/13
Industrial Breakdown - Revenue I. 2021, US

10
To see the cost significance of sourcing, let’s look at the data of COGS which typically include purchasing cost of raw materials and manufacturing cost. Data of the publicly traded companies in the US shows that in 2019, the energy sector has the highest COGS, this is followed by materials, industrials, consumer staples, and so on.
10/13
Industrial Breakdown - Revenue II. 2021, US

11
In fact, except for financials, all other sectors have a COGS as the biggest cost component ~ > 40% of revenue. Because the purchasing cost is often much greater than the mfg cost (as we explained earlier), this data indicates the vital importance of cost control in sourcing.
11/13