Enterprise Ranking - Total Revenue

10
US, China, Japan, Korea IT firms, 2020. Among 20 largest IT companies: 15 are hardware, 5 software / IT services. Apple and Samsung are the top 2! Samsung Electronics is much more diversified, e.g., consumer electronics, household appliances, technology hardware, semi-conductors, etc.
10/60
Industrial Trend - Industry Total Size

11
Looking specifically at the technology hardware & peripheries sub-industry (including providers of smart phones like Apple), an industry trend analysis shows that up to the fiscal year of 2020, this sub-industry is increasing and stable in the US. Comparing US, Korea and Japan, US is the largest in both revenue and profits, Korea has the most fluctuated profits, Japan is the smallest in both revenue and profit. However, US has the lowest proportion of profitable enterprises – the highest % of companies losing money.
11/60
Operating Margin vs. Revenue

12
Looking at the SP500 US IT companies including both hardware and software companies, Apple is leading the way in total revenue but not in profit because its (operating) profit margin is clearly lower than MSFT, FB and many other IT firms.
12/60
Profit vs. Cost - Operating Income

13
Looking at the profitability from a different angle (operating profit vs. total cost), we can make the same observation: Apple spent twice as much as MSFT in FY 2020, but had a lower operating profit in $ value. That is, MSFT made more $ with less cost in 2020. We also note that Google is below the average level.
13/60
Enterprise Breakdown - Revenue: Technology Hardware, 2020

14
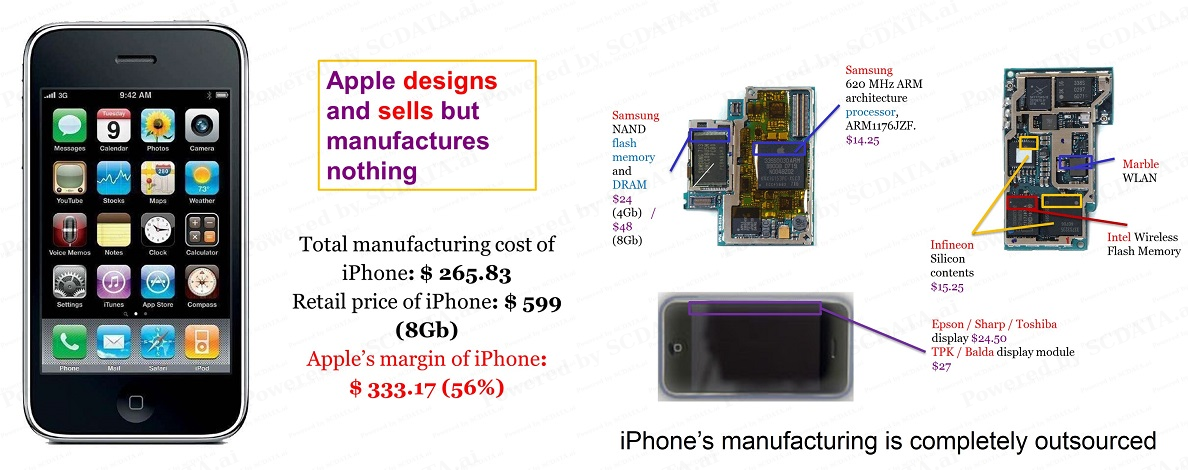
Looking into the revenue breakdown of the technology hardware & peripheries industry and comparing a few companies (Apple, Dell, HP), we can understand their cost structure and sourcing objectives a lot better. We can see that the industry average COGS accounts for 66% of the revenue. With ~ 62%, Apple is doing better than the industry average, but COGS (especially purchasing cost as Apple does little manufacturing by itself) is still the major cost driver. In comparison, HP has a more urgent need to work on sourcing and manufacturing as its COGS is >= 80% of the revenue. The main issue of Dell is its Sales, General & Admin cost, which is almost twice as much as the industry average. Dell’s COGS is also on the high side, and so Dell needs to work on both COGS and SG&A.
14/60
Industrial Breakdown - Revenue - Health care equipment & services vs. Pharmaceuticals, Bio-tech & life sciences

17
Pharmaceuticals, Bio-tech & life sciences has much lower COGS (33%), but higher operating costs, SG&A (27%), R&D (23%) than health care equipment & services (57%, 9.6%, 1.03%) --> outsourcing to reducing COGS is less important to the former but operating cost is the major cost driver.
17/60
Industrial Breakdown - Revenue: biotech vs. pharm, 2020

18
For Pharm, COGS vs. SGA vs. R&D = 31.88% vs. 25.5% vs. 19.85%. For biotech: COGS vs. SGA vs. R&D = 18.1% vs. 33.4% vs. 47.82%. SG&A includes nearly everything that isn't included in cost of goods sold (COGS). ... Also, research and development costs are not included in SG&A.
18/60
Enterprise Distribution: Semi-conductors 2020 total revenue

20
We first use business geo-information to identify potential countries and suppliers globally. Using Enterprise distribution, we find countries with the highest total revenue in semiconductors in FY 2020: US, China, Korea, Japan, …
20/60
Enterprise Distribution: Semi-conductors 2020 total revenue

21
From the bar chart, we can see more clearly the quantitative difference: US is clearly leading the way in the semi-conductor industry, which is followed by Taiwan, China, Korea and Japan.
21/60
Enterprise Distribution: Semi-conductors 2020 total revenue growth

22
In addition to total revenue, we also look at the growth rate of the semi-conductor industry by country. Generally larger countries typically grow slower. However, you can see that Taiwan and Korea, the largest countries in semi-conductor, also had the highest growth rates. In what follows, we will focus on three countries for semi-conductor suppliers: US, Taiwan, and Korea.
22/60
Industrial Trend - Industry Total Size

23
The trend analysis of the industry total size can compare the semi-conductor industry among different countries for multiple years. We can see that US constantly outperformed Korea and Taiwan in both revenue and profits. Overall, US also has a faster growth in revenue and profits during the recent 5 years than Taiwan and Korea. Taiwan is on the rise but Korea seems to be more fluctuated.
23/60
The semiconductor supply chain

24
Major companies by revenue in semi-conductor industry.
24/60
Concentration and Competition Intensity - Total Revenue

26
Now let us do a market share analysis to see the competition intensity (competitive or monopolized) and stability of the major players. The concentration and competition intensity analysis of the semiconductor sub-industry in the US shows that the market shares are stable, and the market is relative competitive with a few whales and many smaller fish. The major players are Intel, Qualcomm, Micron and TI.
26/60
Concentration and Competition Intensity - 4-firm concentration ratio

27
The four firm concentration ratio shows that the top 4 US semi-conductor companies account for some 60% of the market share (revenue of all US firms), and is becoming less concentrated over time! It is not monopoly or duopoly market but has quite some choices out there.
27/60
Concentration and Competition Intensity - Operating income

28
The net income analysis shows a different picture: while Intel and TI made a stable net income over the past few years, Qualcomm and Micron are quite fluctuated in net income. Indeed, Qualcomm’s net income is negative in 2018, Micron made a huge net income in 2018 which gradually decreased in 2019 and 2020.
28/60
Enterprise Ranking - Total Revenue

29
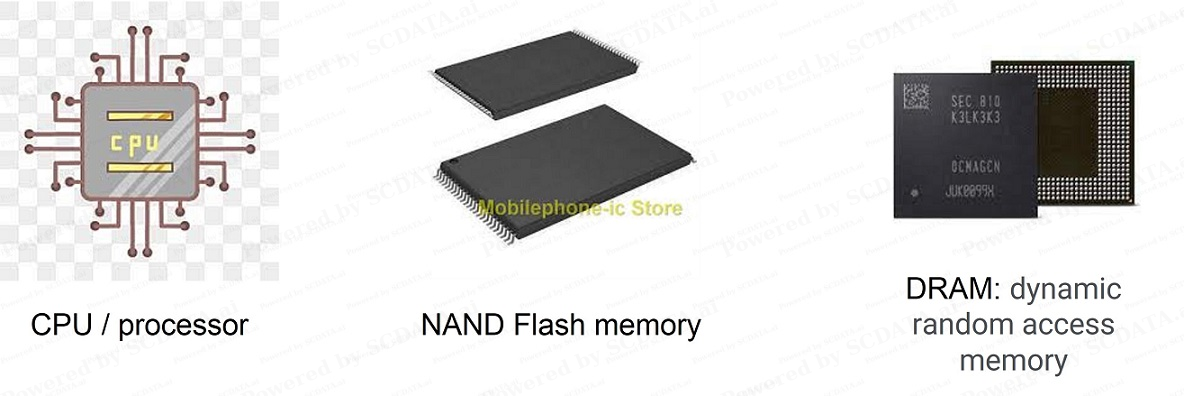
We can pick a few potential suppliers for CPU / processors from the enterprise ranking of the publicly traded semi-conductor companies in US, Taiwan and Korea. As an example, Intel, TSMC, Qualcomm are picked because of their size, Gobalfoundries is picked to enhance supplier diversity. Feel free to pick other companies as you wish in your analysis.
29/60
Monopolized Market

32
US Railroads: no alternative suppliers for rail freight services – take it or leave it.
32/60
Duopoly market

33
Deadly rivalries may mean opportunities for the buyers. How to take down two giants at one time? Let them compete for your business – of course, your volume should be high and so leveraging. US air freight companies UPS and FedEx are global and compete intensively everywhere.
33/60
Enterprise Trend - Size

34
Data for Huawei BPI calculation
34/60
Enterprise Comparison - Size

37
Let us first perform an enterprise comparison on size for the potential suppliers of CPU for iPhone: Intel, Qualcomm, TSMC, Samsung and GF. We can see that in FY 2020,. Samsung is bigger in $ value than Intel > TSMC > Qualcomm > Global Foundries which suffered some loss in 2020.
37/60
Enterprise Comparison - Profitability

38
Looking specifically on profitability (the margins) in FY 2020, we can see that Global Foundries lost quite significantly with an even negative gross margin! Samsung is less profitable on all margins than the rest – understandable because Samsung also sell a variety of products other than semi-conductors. Looking carefully at the rest (Intel, Qualcomm, TSMC), you can see Qualcomm has the highest gross margin but the lowest operating and net margins. TSMC has the lowest gross margin but the highest operating and net margins, Intel is in between. Their gross margins are high, in the range of 53~61% (implies that they are all technically capable and innovative). But TSMC seems to have the lowest pricing and made the highest margins.
38/60
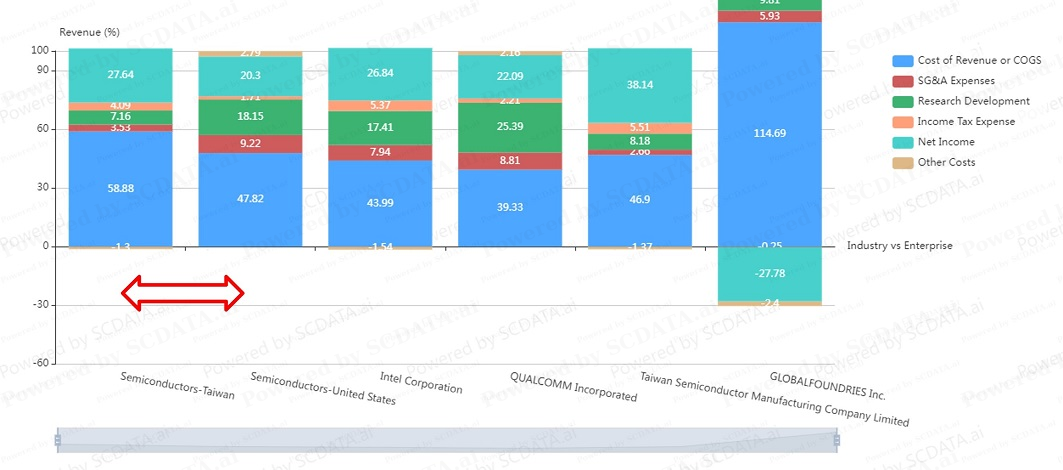
Enterprise Breakdown - Revenue

39
The revenue breakdown analysis of 2020 semiconductors sub-industry for US and Taiwan - shows more details: * Intel has good control of COGS and thus a likely high pricing, it has a high spend on R&D, and made tons of $ * Qualcomm has the lowest COGS and thus likely the highest pricing, it also has the highest spend on R&D, and made tons of $ * TSMC likely has the highest COGS among the three and so likely the lowest pricing, it spends less on R&D, lowest on SG&A, and made the highest net margin. * GF’s COGS is greater than its revenue, and was losing quite $ in this year. You will not hire TSMC to do design and research but manufacturing.
39/60
Enterprise Trend - Profitability

41
Look at trends of these companies over time, we can see that our observations made before are consistent over time. * Intel’s profit margins are stable and increasing – it is becoming more competitive. * TSMC’s lower gross margin but highest operating / net margins are also consistent. * Qualcomm has high and comparable gross margins as Intel but its operating and net margins are less stable. Samsung had the lowest margins (still profitable) among all. GF has been losing $ for 3 consecutive years now.
41/60
Enterprise Comparison - Profitability

44
Returning to the semi-conductor suppliers for iPhone, let’s look at their financial health indicators, such as current ratio and quick ratio (short-term risk), liability asset ratio (long-term risk), and operating cash net income ratio (cash flow from operating activities per $ of net income). We can see that they all look healthy in the short-term because the current / quick ratios are all greater than 1, even GF is healthy despite its recent losses. They also all look healthy in the long-term because their liability asset ratio < 1 (inverse > 1) except Qualcomm close to 1 indicate some long-term risk. Except for GF which has a negative cash flow, all made good cash flow from operations as the operating cash net income ratio > 1, cash flow from operations is preferred to investment and financing because there is less room to manipulate results through accounting tricks.
44/60
Enterprise Breakdown - Liabilities vs. Equity

45
Breaking down these companies’ total assets by liabilities and stockholder equity, we can see that TSMC has the highest % of equity and lowest total liabilities. Qualcomm has significantly more non-current liabilities than other suppliers. Intel is very healthy on equity and liabilities with equity > 50% of the total assets. Despite losing money, GF is also very healthy in terms of equity and liabilities.
45/60
Enterprise Breakdown - Detailed Assets

46
Breaking down their assets into details, we find that TSMC has the highest cash and second largest property plants and equipment – high production capacity and responsiveness. Intel has a decent production capacity but may run a bit low on cash. Qualcomm has a surprisingly low property plants – putting its production capacity and responsiveness at question. GF has the highest property and plant – it has built up a strong production capacity, the company also has a good amount of cash.
46/60
Enterprise Trend - Financial health

47
The trend analysis reveals these companies’ financial health over time. We can see that over the recent years, TSMC, Samsung, Intel and GF have little short / long term risks and thus excellent financial health and stability. While Qualcomm is fine on short-term risk, its liabilities asset ratio and long-term debt ratio upswing quite significantly in recent years almost to the danger zone in 2018, the good news is that after 2018, the situation become less severe for qualcomm.
47/60
Enterprise Comparison - Profitability

50
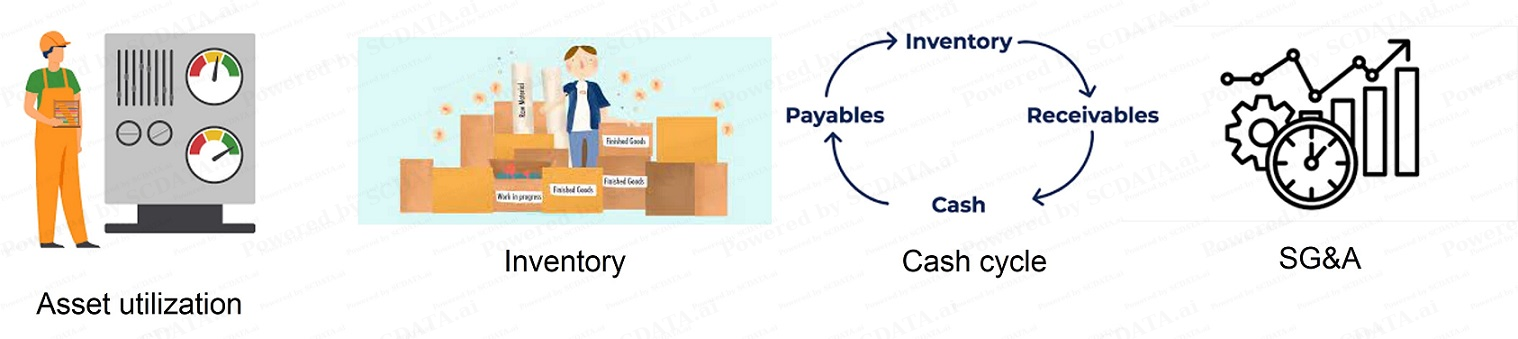
An enterprise comparison on efficiency among the potential suppliers for CPU of iPhone shows that asset utilization wise, TSMC / Intel are heavier on assets than Qualcomm and Samsung but lighter than GF. Inventory wise, GF best, TSMC / Samsung better, Intel / Qualcomm need to improve. Cash cycle, TSMC best. TSMC power is strong as reflected by receivable days is 14% of payable days ~ Intel. GF is the weakest. SGA cost efficiency, TSMC is the most efficient, Samsung the least.
50/60
Enterprise Trend - Efficiency

51
Look at the trend over time, we can see that inventory days are more or less stable for all players and the observation is consistent to 2020. Cash cycle: TSMC improves a lot recently, Intel / Qualcomm / GF remained stable. Payable days over receivable days are increasing for Intel and TSMC, which indicates that they are building up their market / negotiation power recently.
51/60