Meta
Business Intelligence & Competitive Analysis
Supriya Mamidi
Supply Chain Management Major
Rutgers Business School - Newark

Meta 2019

Chart Analysis

Management Consulting

Business Intelligence and Competitive Analysis
1. Industry Analysis - business, GIS, industry trend, competition intensity, value chain analysis
2. Competitive positioning - where do I stand in the competitive landscape
3. Enterprise diagnosis - strengths and weaknesses, value drivers & breakdown analysis

How do I know that I have a problem?

Global Competition Positioning System (GCPS)

Industry Overview

Enterprise Distribution Results
In 2021, the total number of internet software enterprises is the most in California

Typical Firm Performance by Region - Profit Distribution
In 2021, internet software companies located in Washington had the highest median revenue

Results
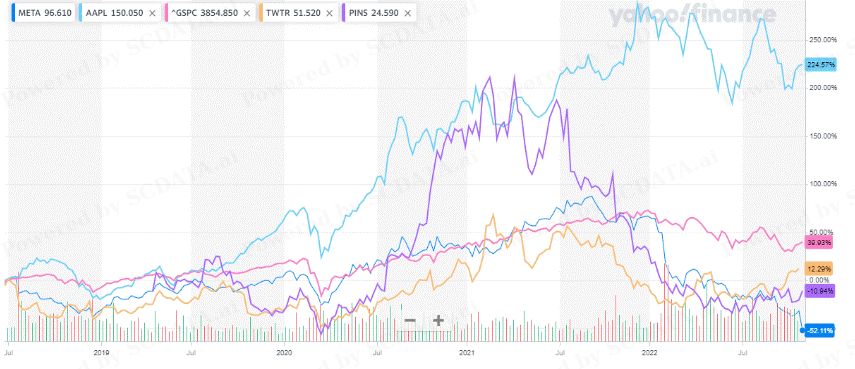
In 2015-2021, Apple has the most amount of total revenue compared to its competitors

Concentration and Competition Intensity
the US Internet software and services industry is more concentrated than China

Industrial Analysis I

Industrial Trend
Internet Software & Service companies in the US have a higher total revenue compared to their competitors in China

Industrial Trend - Profitability
Internet Software and Service companies in the US had a higher median gross margin than their competitors in China

Industrial Trend - Efficiency
Internet Software and Services in China had a higher median return on assets compared to their competitors in the US

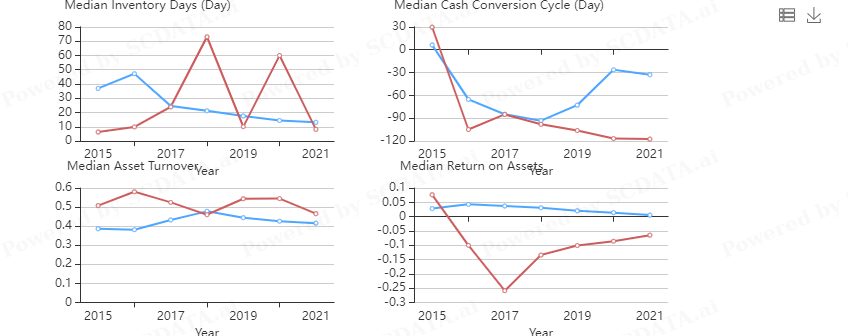
Results of Industrial Trend - Financial Health

Industry Analysis II

Supply Chain Mapping - Median Total Revenue
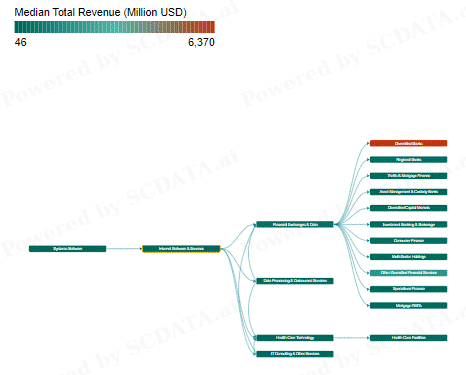

Supply Chain Mapping Median Total Revenue

Supply Chain Mapping - Median Net Margin

SC Mapping - Median Net Margin

Supply Chain Mapping - Median Return on Assets

Results of SC Mapping - Median Return on Assets
In 2021, asset management and custody banks have the highest median return on assets

Competition Positioning I

Results of Revenue v. Cost
Internet software and services in the US is higher in terms of revenue and cost compared to their competitors in China

Profit vs. Cost - Operating Income

Operating Profit vs Total Assets

Operating Margin vs. Revenue

Return on Assets vs. Liability Asset Ratio

Competition Positioning II

Enterprise Ranking - Total Revenue

Enterprise Ranking - Operating Margin

Results of Enterprise Ranking - ROA

Results

Enterprise Diagnosis I

Major Competitors to Meta

Results

Results

Results
In 2021, Meta has the highest return on assets compared to its competitors in return on equity, return on invested capital, and return on assets

Results

Results

Enterprise Diagonsis II

Results

Results

Results
Overall
Meta's cash conversion cycle has been decreasing
Meta's labor productivity has increased
Meta's receivable days has increased

Value Driver Analysis and Breakdown

Results

Results

Result

Results

Results

Insights

Conclusion


