Competitive Intelligence Report
Mario Echeverria Morante
Student Supply Chain Analytics
RUID: 212001486
Rutgers Business School

Nike Inc
Nike is the largest supplier of athletic footwear and apparel in the world
It is currently ranked 35th in the S&P 500 and owns 43.7% of the athletic brands market
Employs over 79,000 people

Trend Analysis
In my trend analysis you can see that within Textiles, Apparel, & Luxury Goods, Footwear has been pretty much the leader for profitability within the industry for the past 5 years, beating out Textiles and Apparel, Accessories & Luxury Goods.
Risks within the industry include declining performance through time. Gross Margin has remained level with brief periods of decline. While Operating and Net Margin have steadily decreased substantially. Although they are steadily getting back to peak periods many factors are to be considered such as economic health of the consumer. Textiles especially has consistently decreased performance. Growth is also a risk as it seems this industry experiences very little growth.
Potential within the industry is the ability to stay consistent with performance. Regardless of declining metrics, this industry seems to find its way back to its peak performance or remain level over time.

Competition Intensity
Footwear - Nike is the biggest company in the US owning about 70% of the market. While a few companies have been able to enter the footwear industry, it seems as though they are competing for the small percentage left by Nike.
Apparel - While a few years ago there were very few companies with an even distribution of the market, currently no particular company owns a majority of this market, making it extremely competitive. It has also welcomed many new players, reducing the share of the bigger companies.
Textiles - The most monopolized within this industry. There are four key players with two owning over 85% of the market. This would seem the hardest industry to enter, especially for smaller companies.

Value Chain
The most valuable segment in the US within the value chain is the end product. Footwear has the highest net margin within the value chain making it the most attractive.
Outside of the US footwear is has the lowest net margin. The most valuable segments of the supply chain are the natural resources used in the production of these products. Natural resources tend to be monopolized which would make it difficult to expand into those markets.

Profit Frontier
Due to Nike's almost 70% market share in Footwear in the U.S., comparing it to its closest competitor Adidas (Germany) was important in understanding whether Nike's operations were really outperforming all of the other companies in the Footwear industry.
The top 2 companies in each country were Nike & Skechers (U.S.) and Adidas & Pumas (Germany). While Nike produced substantially more revenue than all of its competitors, Adidas was able to outperform it in profits as they were able to generate similar operating income with fewer costs. Pumas and Skechers performed similarly in all categories.
While Nike generates the highest revenue in the U.S. it sits in the middle in regards to return on assets and operating margin. This may be due to varying trends in the U.S. market that Nike has not been able to capitalize on.

Enterprise Ranking
Nike is ranked #1 in revenue generation compared to its U.S. competitors. Nike generates more revenue than all other U.S. based companies combined. Its ranking drops when comparing return on assets. Nike is ranked 5th for return on assets putting it directly in the middle compared to its competitors.

KPI Examination
Where am I positioned among peers in the same industry? Nike is within normal ranges compared to its competitors within Footwear. It does perform on the lower side for both Total Revenue Growth Rate and Operating Income Growth Rate. This may be due to its size compared to its competitors and the competitors ability to capitalize on fashion trends. While Nike has a low operating income growth rate, lowering costs must be carefully examined as it has already faced backlash for using sweat shops to manufacture its products to maintain low production costs.

Enterprise Diagnosis
Strengths/Weaknesses
Value Driver Analysis
Breakdown Analysis

Strengths/Weaknesses
Nike's weaknesses include it's Gross, Operating, and Net margins as well as its return on assets compared to its competitors. While its standing is in the middle of the group, costs are obviously an issue for Nike that may need to be addressed to increase its margins.

Value Driver Analysis
While during the first two years of my analysis showed that a higher return on asset generally meant a lower liability to asset ratio, this was reversed in 2021. Crocs Inc massive increase in return on assets compared to its competitors also resulted in a high liability to asset ratio. This could be due to Crocs Inc wanting to capitalize on its growing popularity and needing to fund its increase in demand.

Breakdown Analysis

Summary
Nike is the largest company in the industry by a large margin but underperforms in Gross, Net, and Operating margins as well as Return on Assets compared to its competitors and also lacks in growth.
Nike is and remains financially healthy compared to its competitors and relative to its size which is an indication of consistency performance by the company.
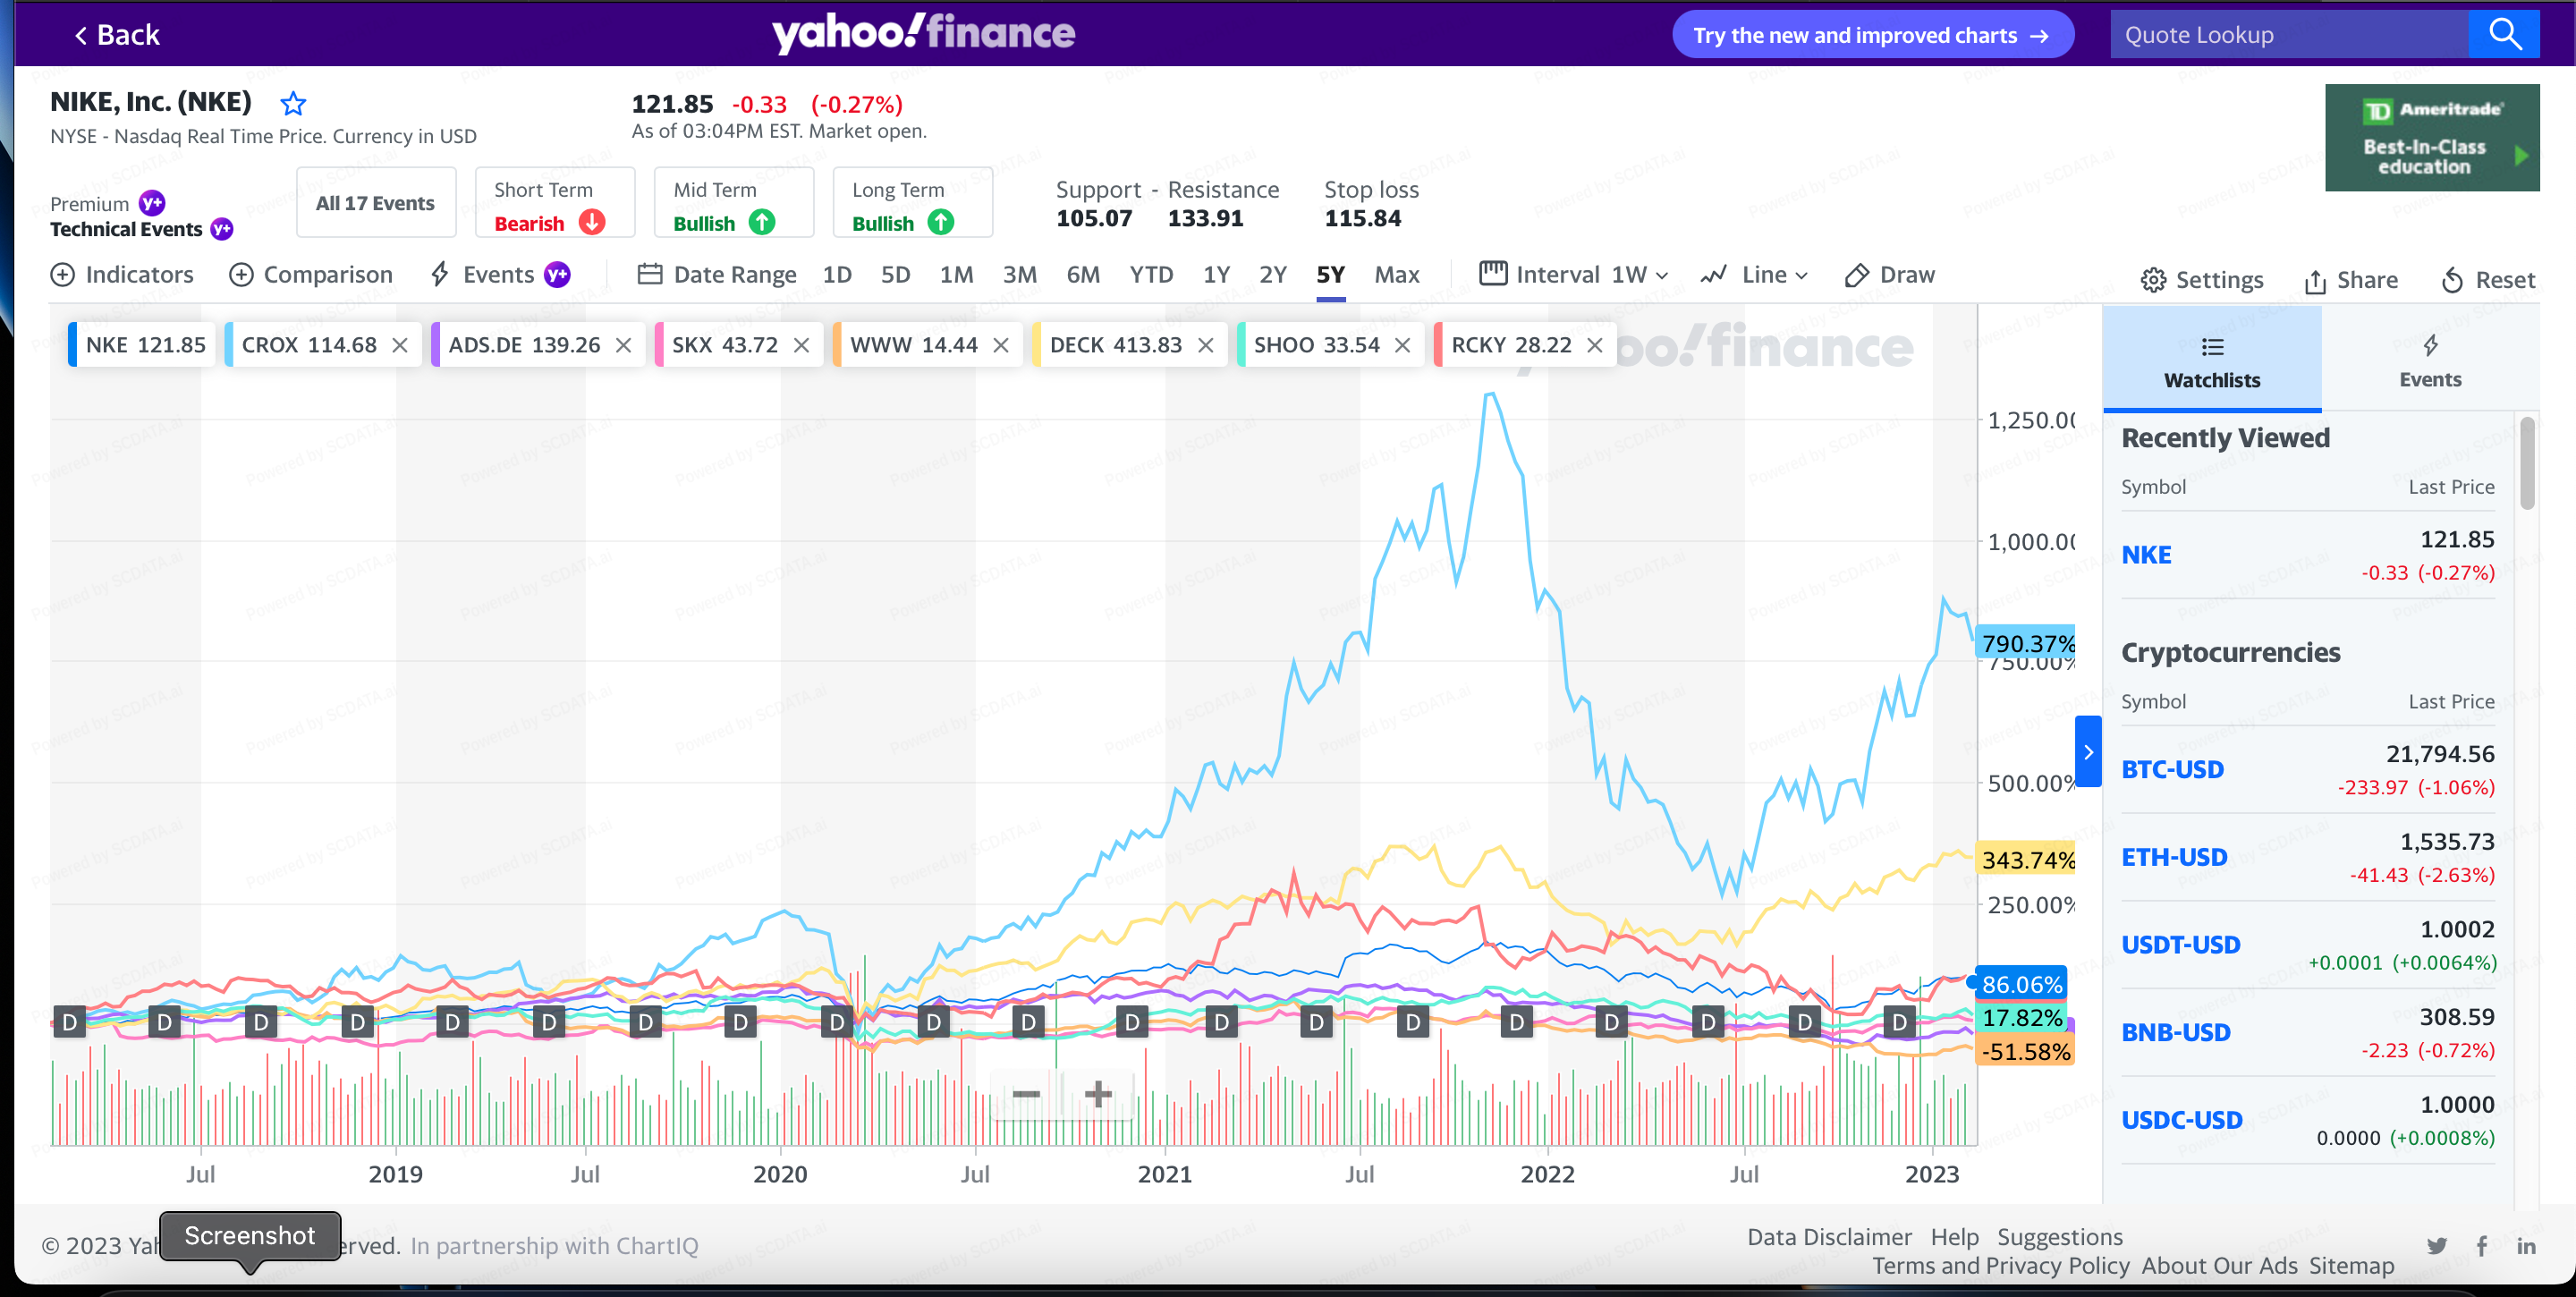
Nike's stock price relative to its competitors did paint the correct picture. While it has been able to remain consistent, many companies are growing at a greater rate. They are also able to produce better profit margins. To become more competitive, Nike must reevaluate its strategy. This may mean looking at and reacting to trends more effectively to capitalize. It also means reducing its COGS but in ways that do not affect its image. Obviously Nike cannot grow as quickly as these other companies due to its already high market share but increasing profit margins is very possible.


