
4
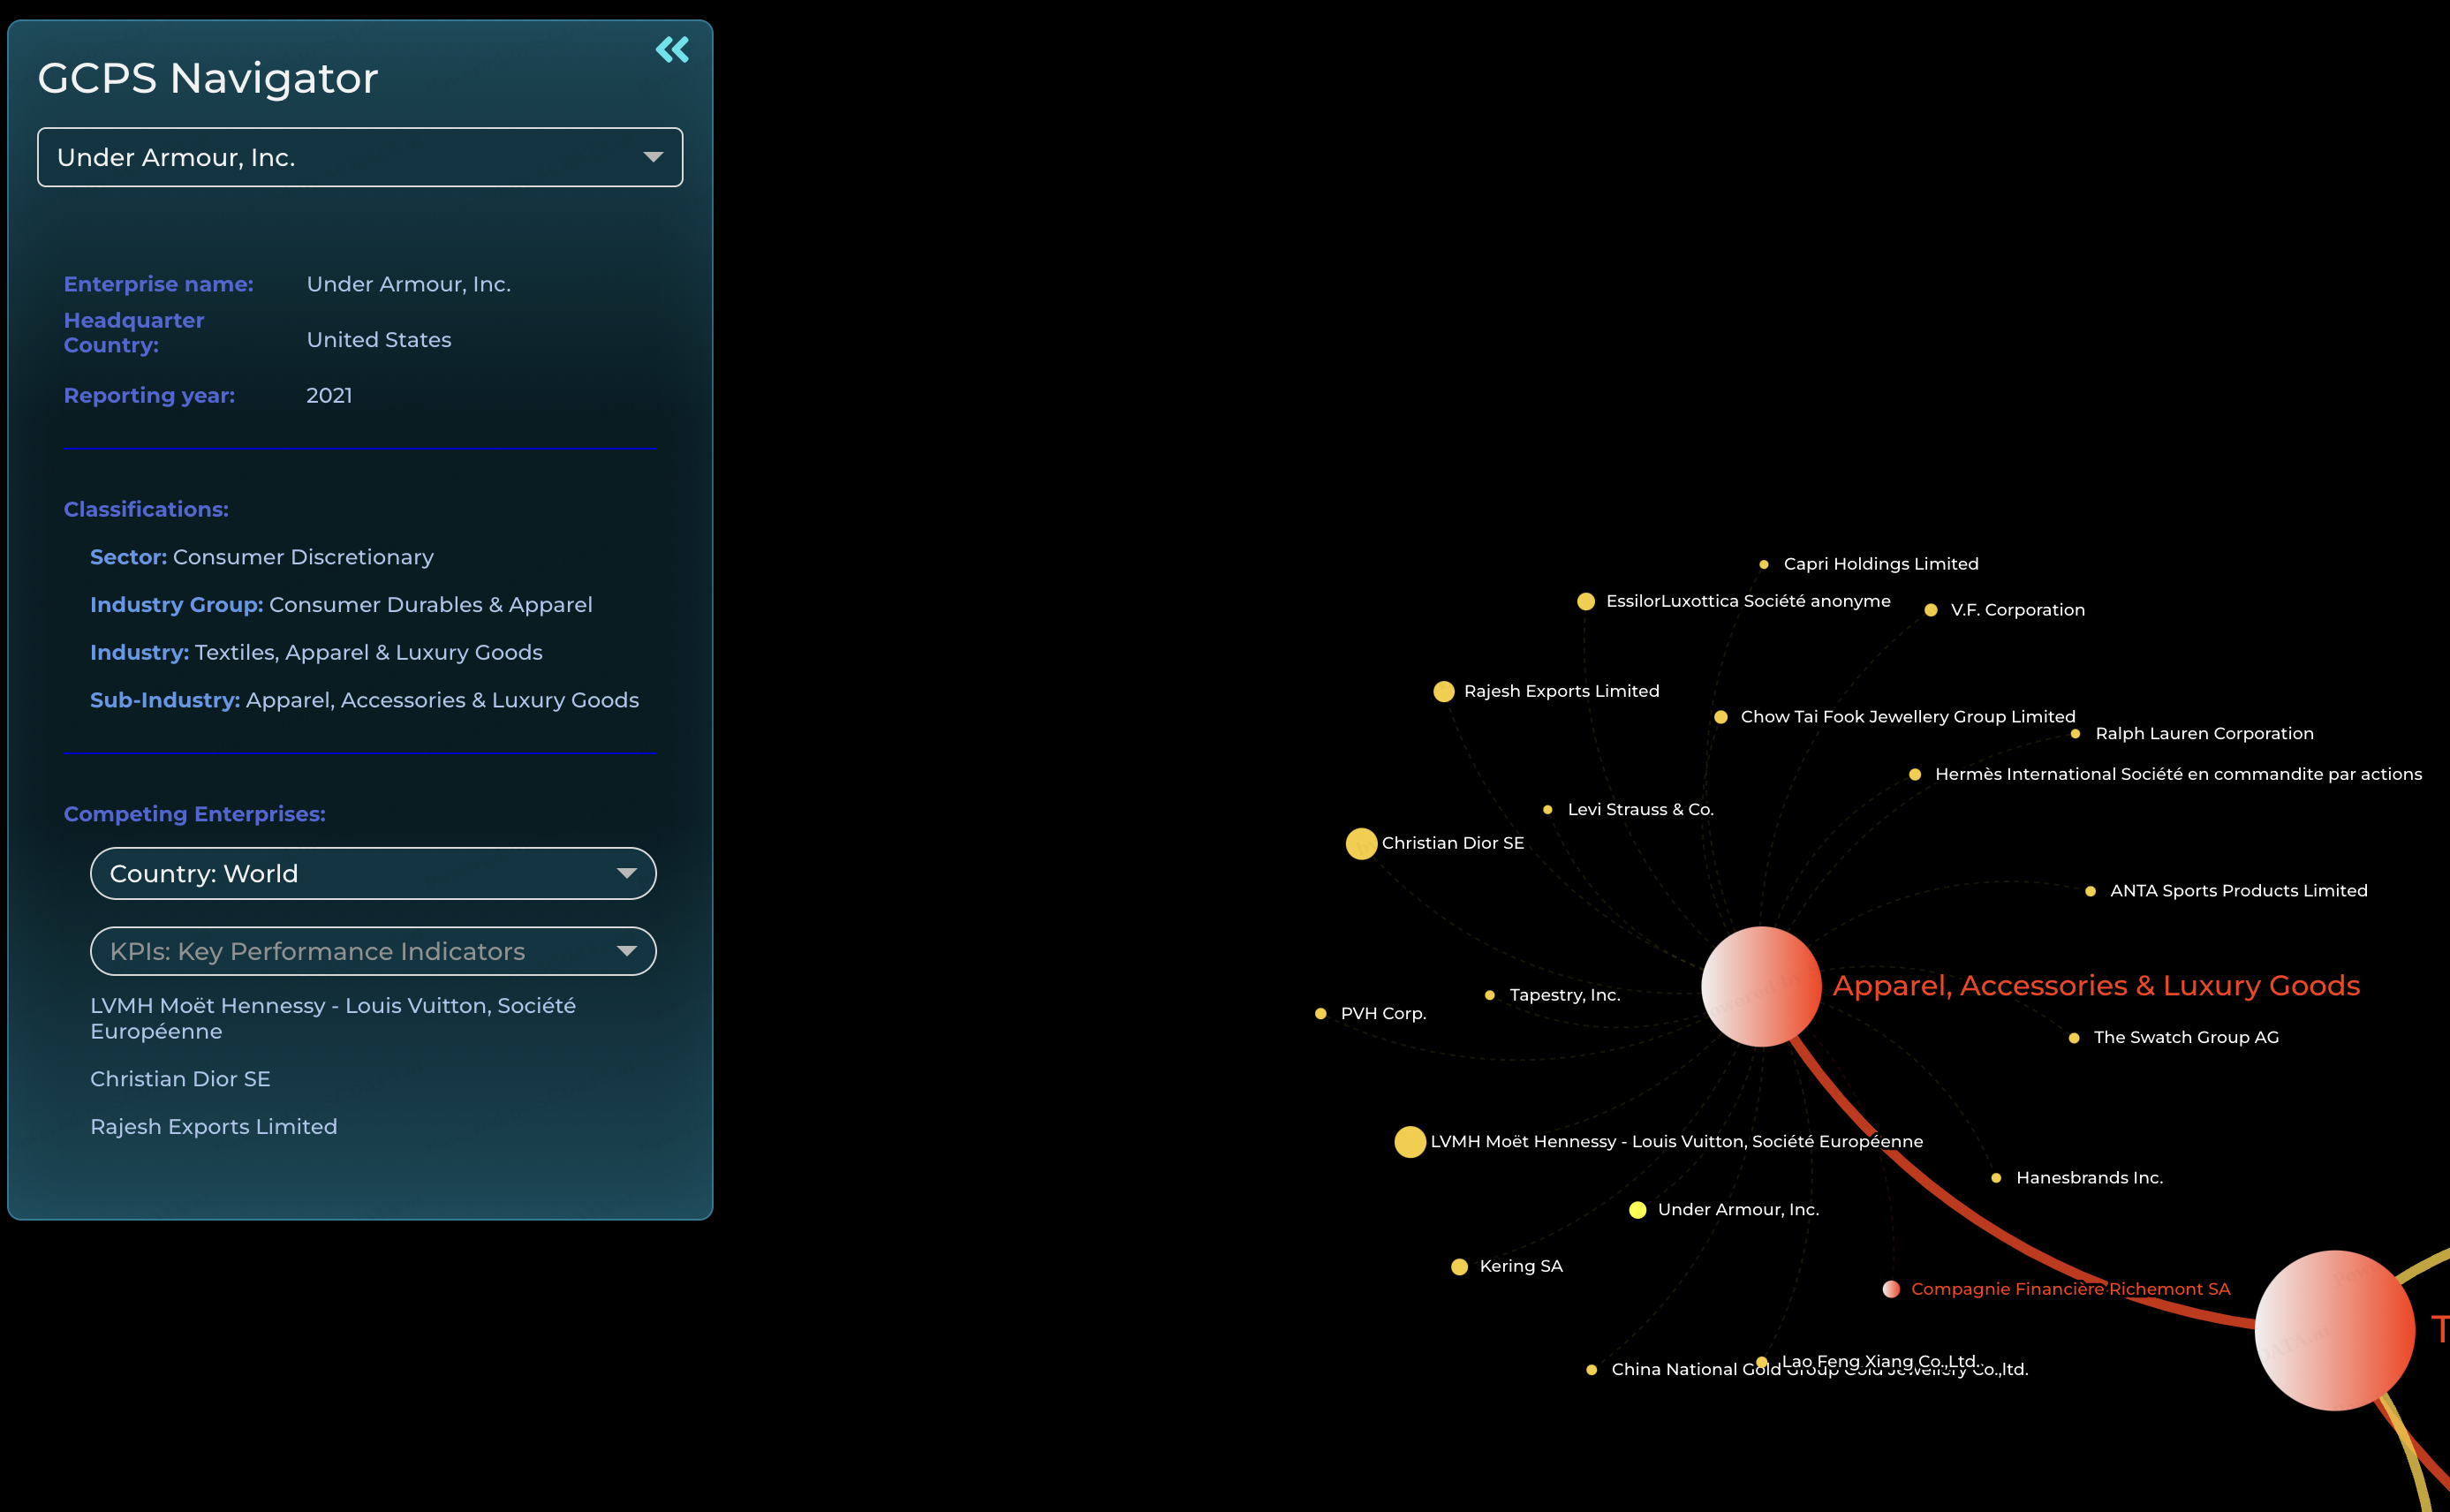
1. In the GCPS's classification, UA belongs to consumer discretionary / Consumer Durables & Apparel / Textiles, Apparel & Luxury Goods / Apparel, Accessories & Luxury Goods
2. The top 3 competing enterprises in the same sector are LVMH, Christian Dior, Rajesh Exports
4/49

5
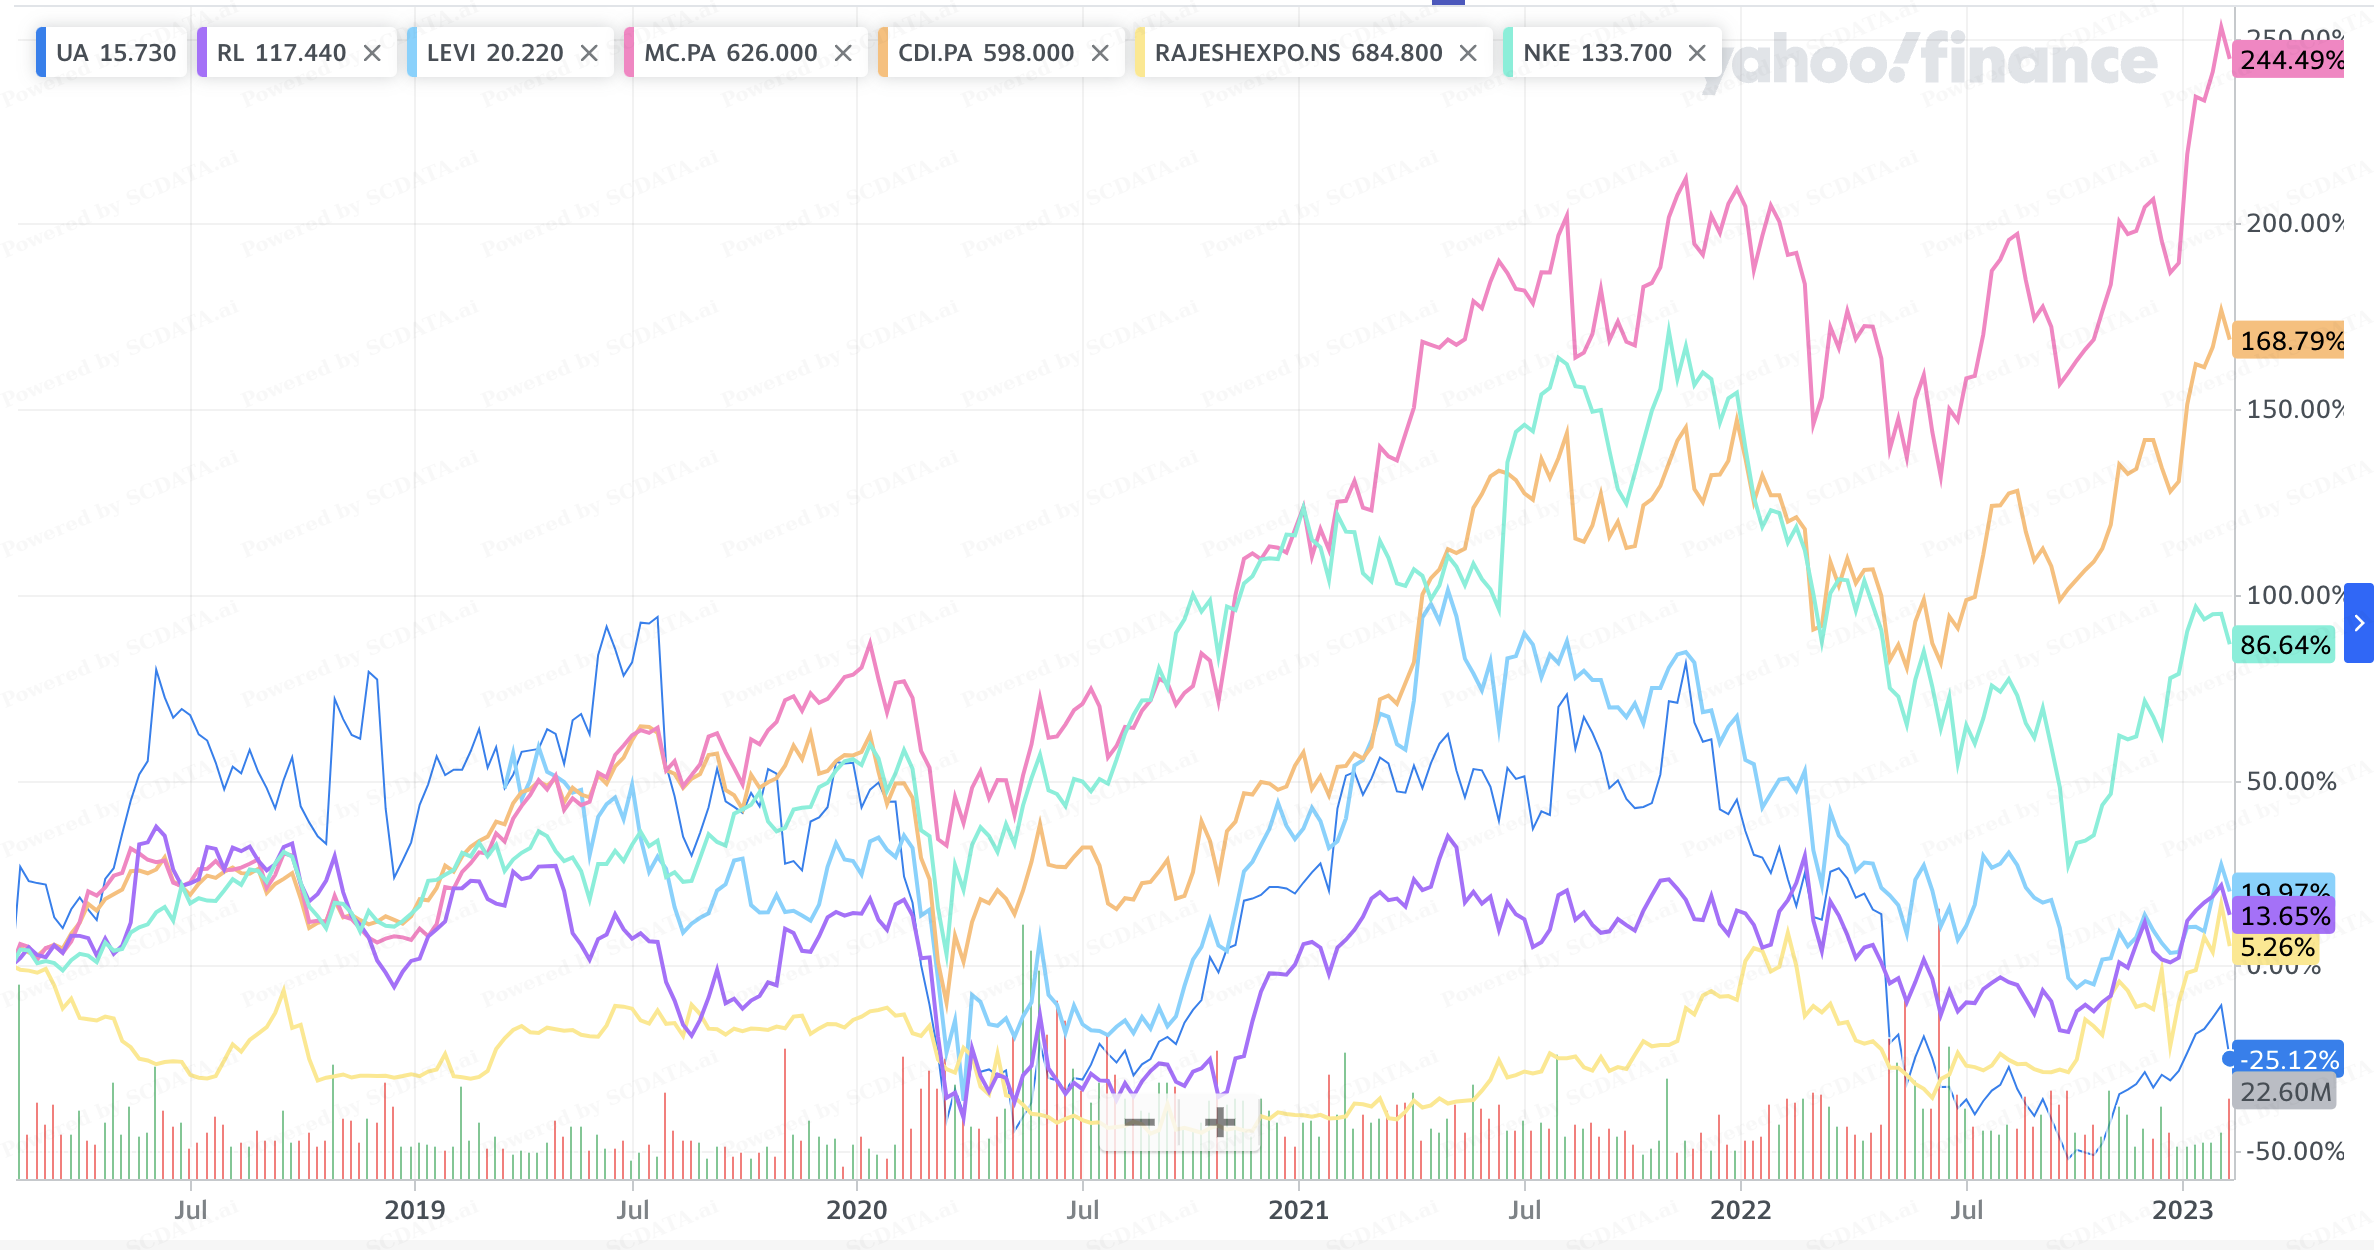
In the five years stock market within the same industry, including the top 3 enterprises and UA, RL, LEVI, NIKE
I found that in the early time, UA even surpassed other companies. However, based on the latest performance. If you invest in a share in the above company, UA will reduce the value of your share to 75%. Additionally, after five years, UA is the only stock that will lose money.
5/49
Industrial Trend - Industry Trend Size

8
From the industry trend analysis, I found that household durables outperformed every aspect of other industries. It is worth noting that household and textile industries didn't have much impact during covid-19 in 2019.
8/49
Industrial Trend - Profitability

9
Although the household industry has a lower gross margin, it has a higher net margin and operating margin. The household industry performs well in profitability. The textile industry UA belongs to has a low operating margin and negative net margin after 2019. It turns out that the pandemic impacted it. I think covid-19 entails higher labor costs, which is critical to the labor-intensive industry.
9/49
Industrial Trend - Growth

10
Looking at growth, the textiles industry rapidly grew after 2020—the same as the household industry, which had been growing flat in past years.
10/49
Industrial Trend - Financial Health

11
No special pattern within five years except for the leisure industry which has high current ratio and cash and cash equivalents in 2019.
11/49
Concentration and Competition Intensity - Total Revenue (SP500 Textiles, Apparel & Luxury Goods)

13
Nike has had more than 50% of the market share in the textiles industry for five years in a row. The top four firms account for 80% of the market share in this industry.
13/49
Concentration and Competition Intensity - Total Revenue (SP500 Household Durables)

14
The top four firms in household durables keep expanding in the five years. Almost account for 80% of revenue in 2021.
14/49
Concentration and Competition Intensity - Total Revenue (SP 500Leisure product)

15
Only two competencies in SP500 belong to the leisure product industry. After 2019, there's only Hasbro dominated the market.
15/49
Concentration and Competition Intensity - Four-firm Concentration Ratio

16
The leisure products industry is the highest concentrated industry of the three. On the other hand, the textiles industry's concentration ratio is also 80%, which validates the previous observation.
16/49
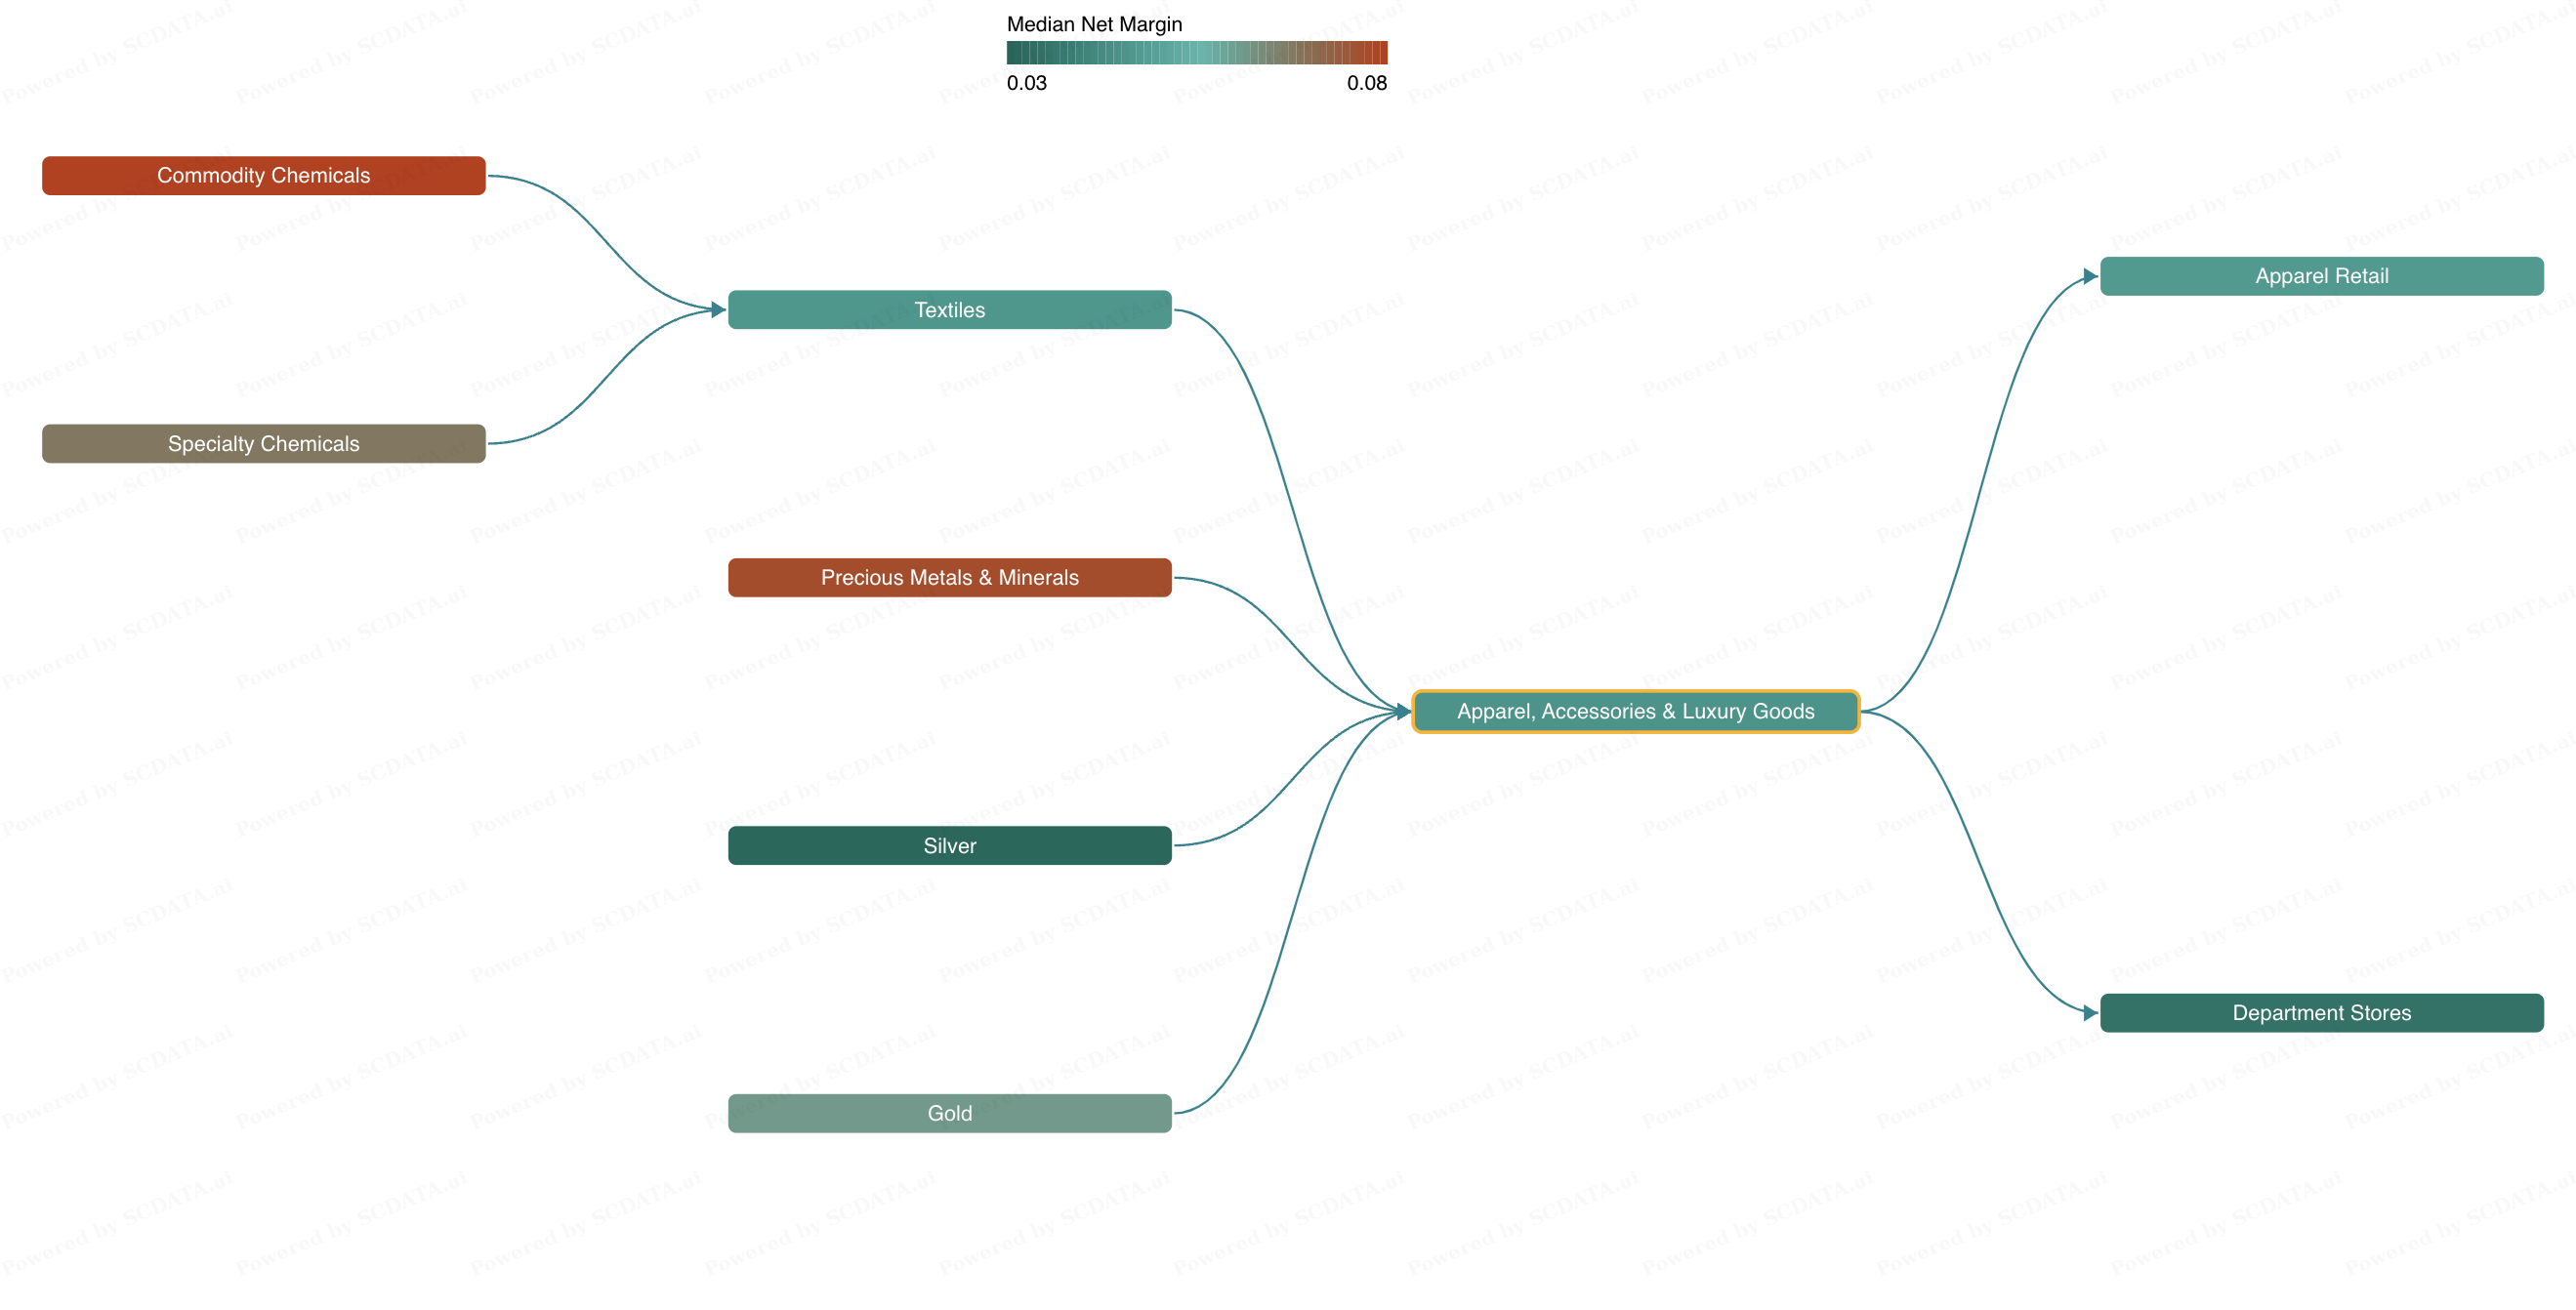
Supply Chain mapping - Net Margin (US 2021)

18
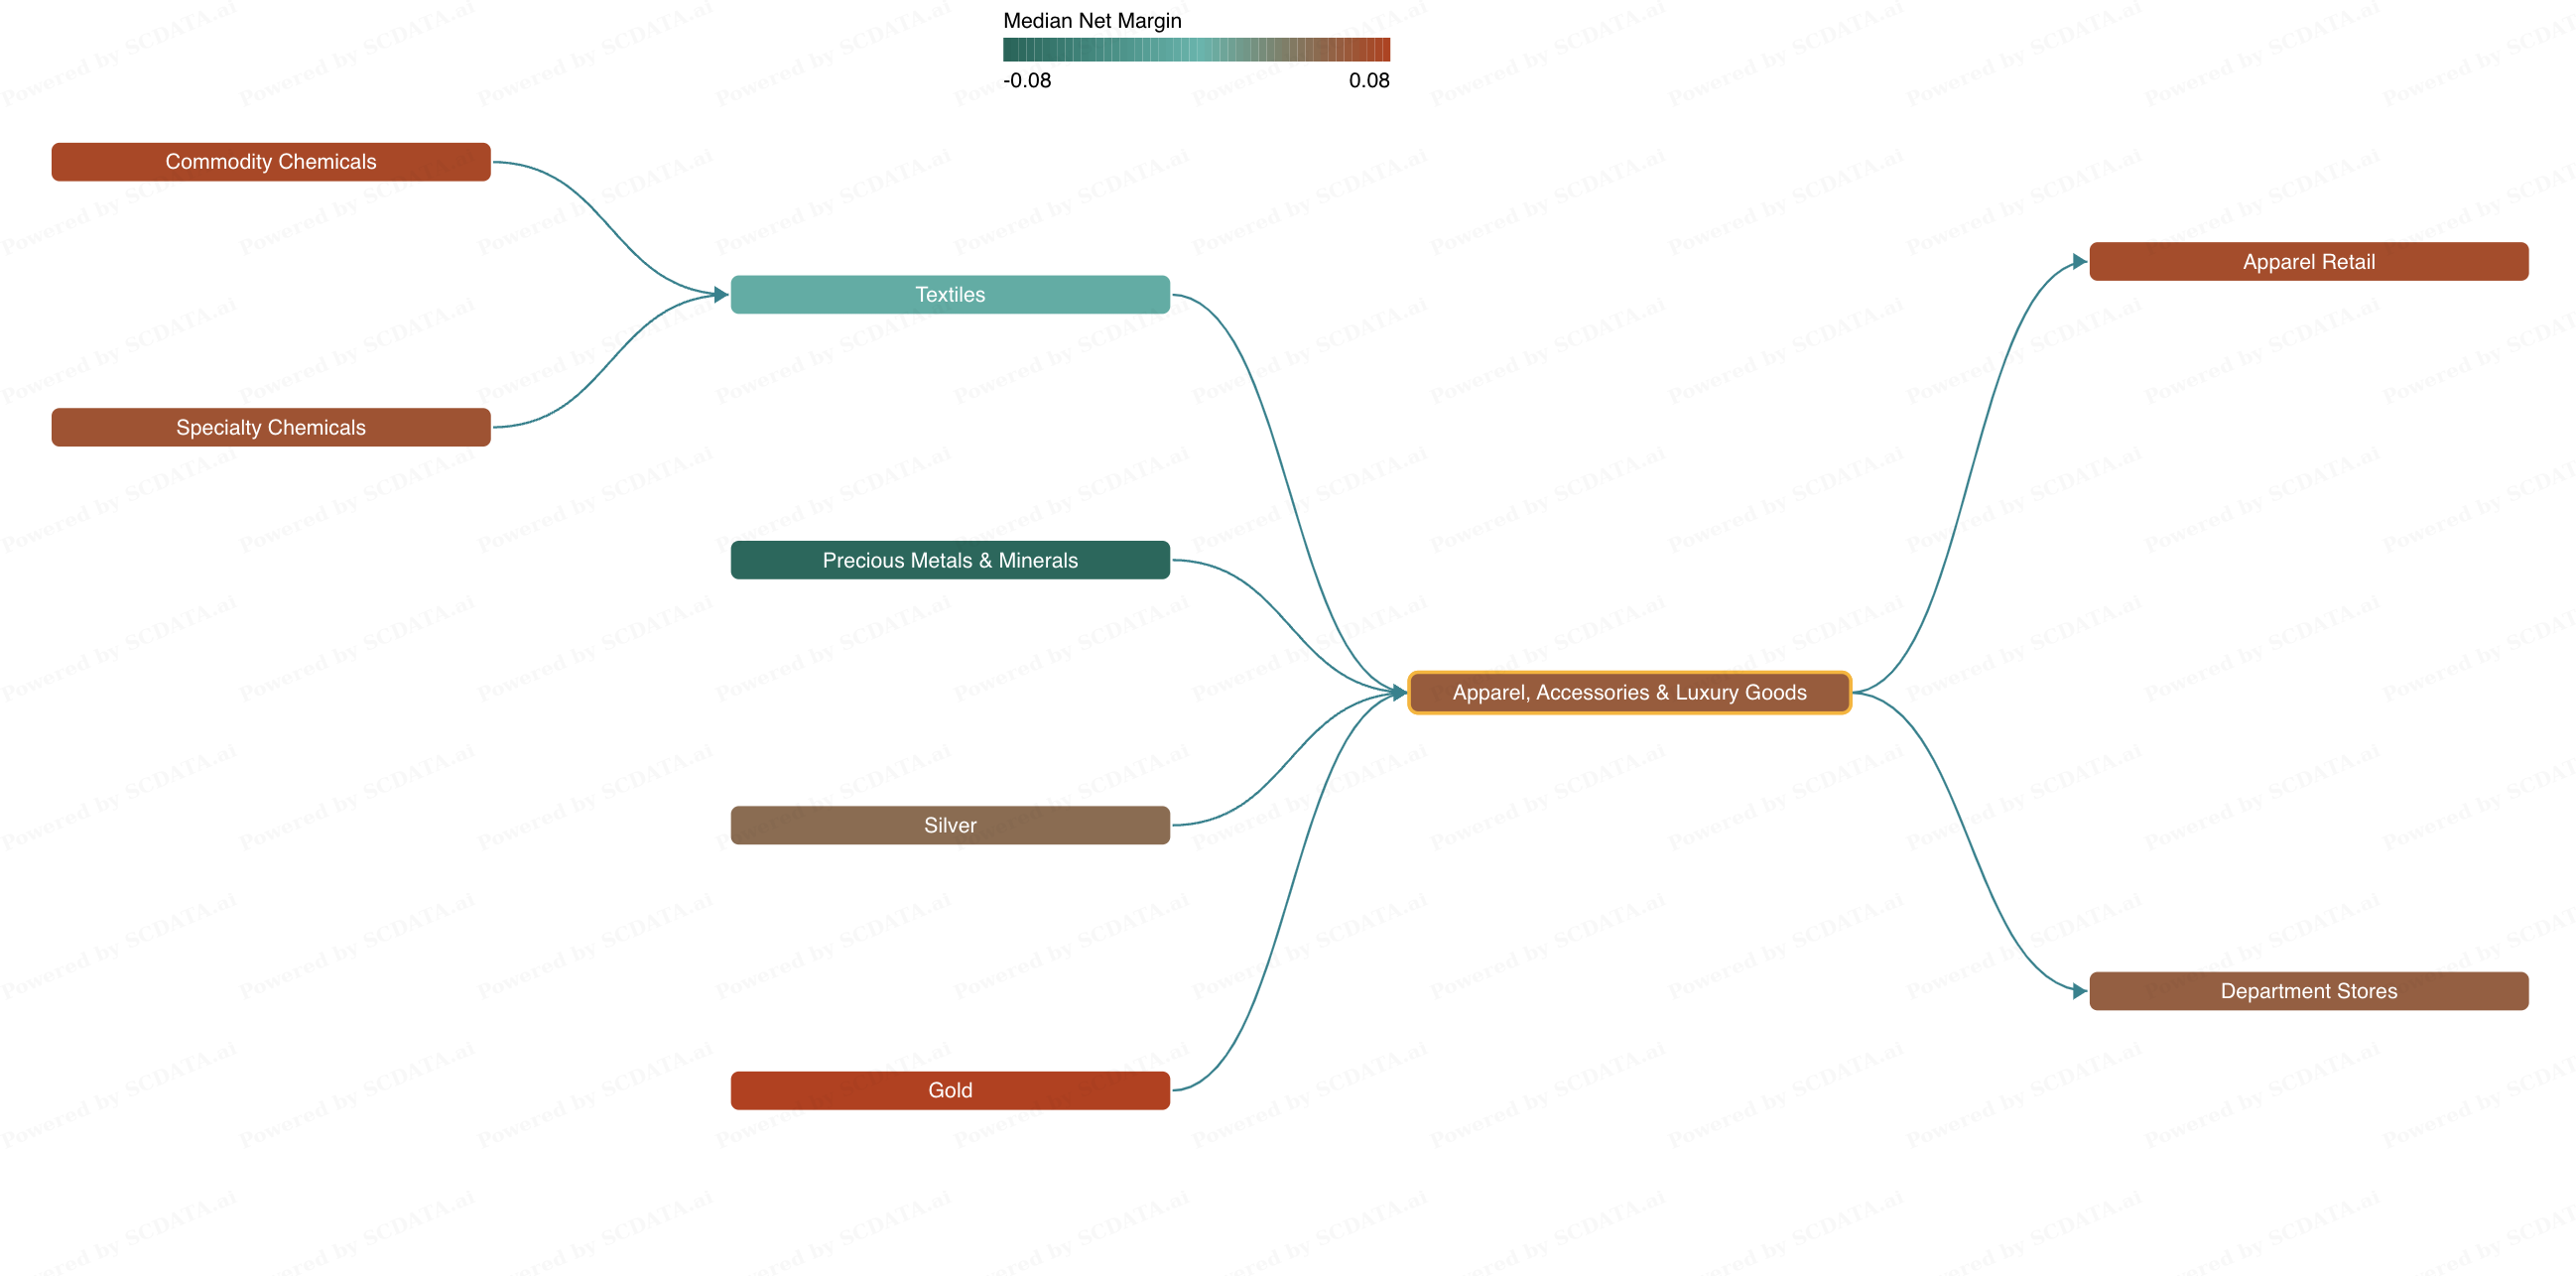
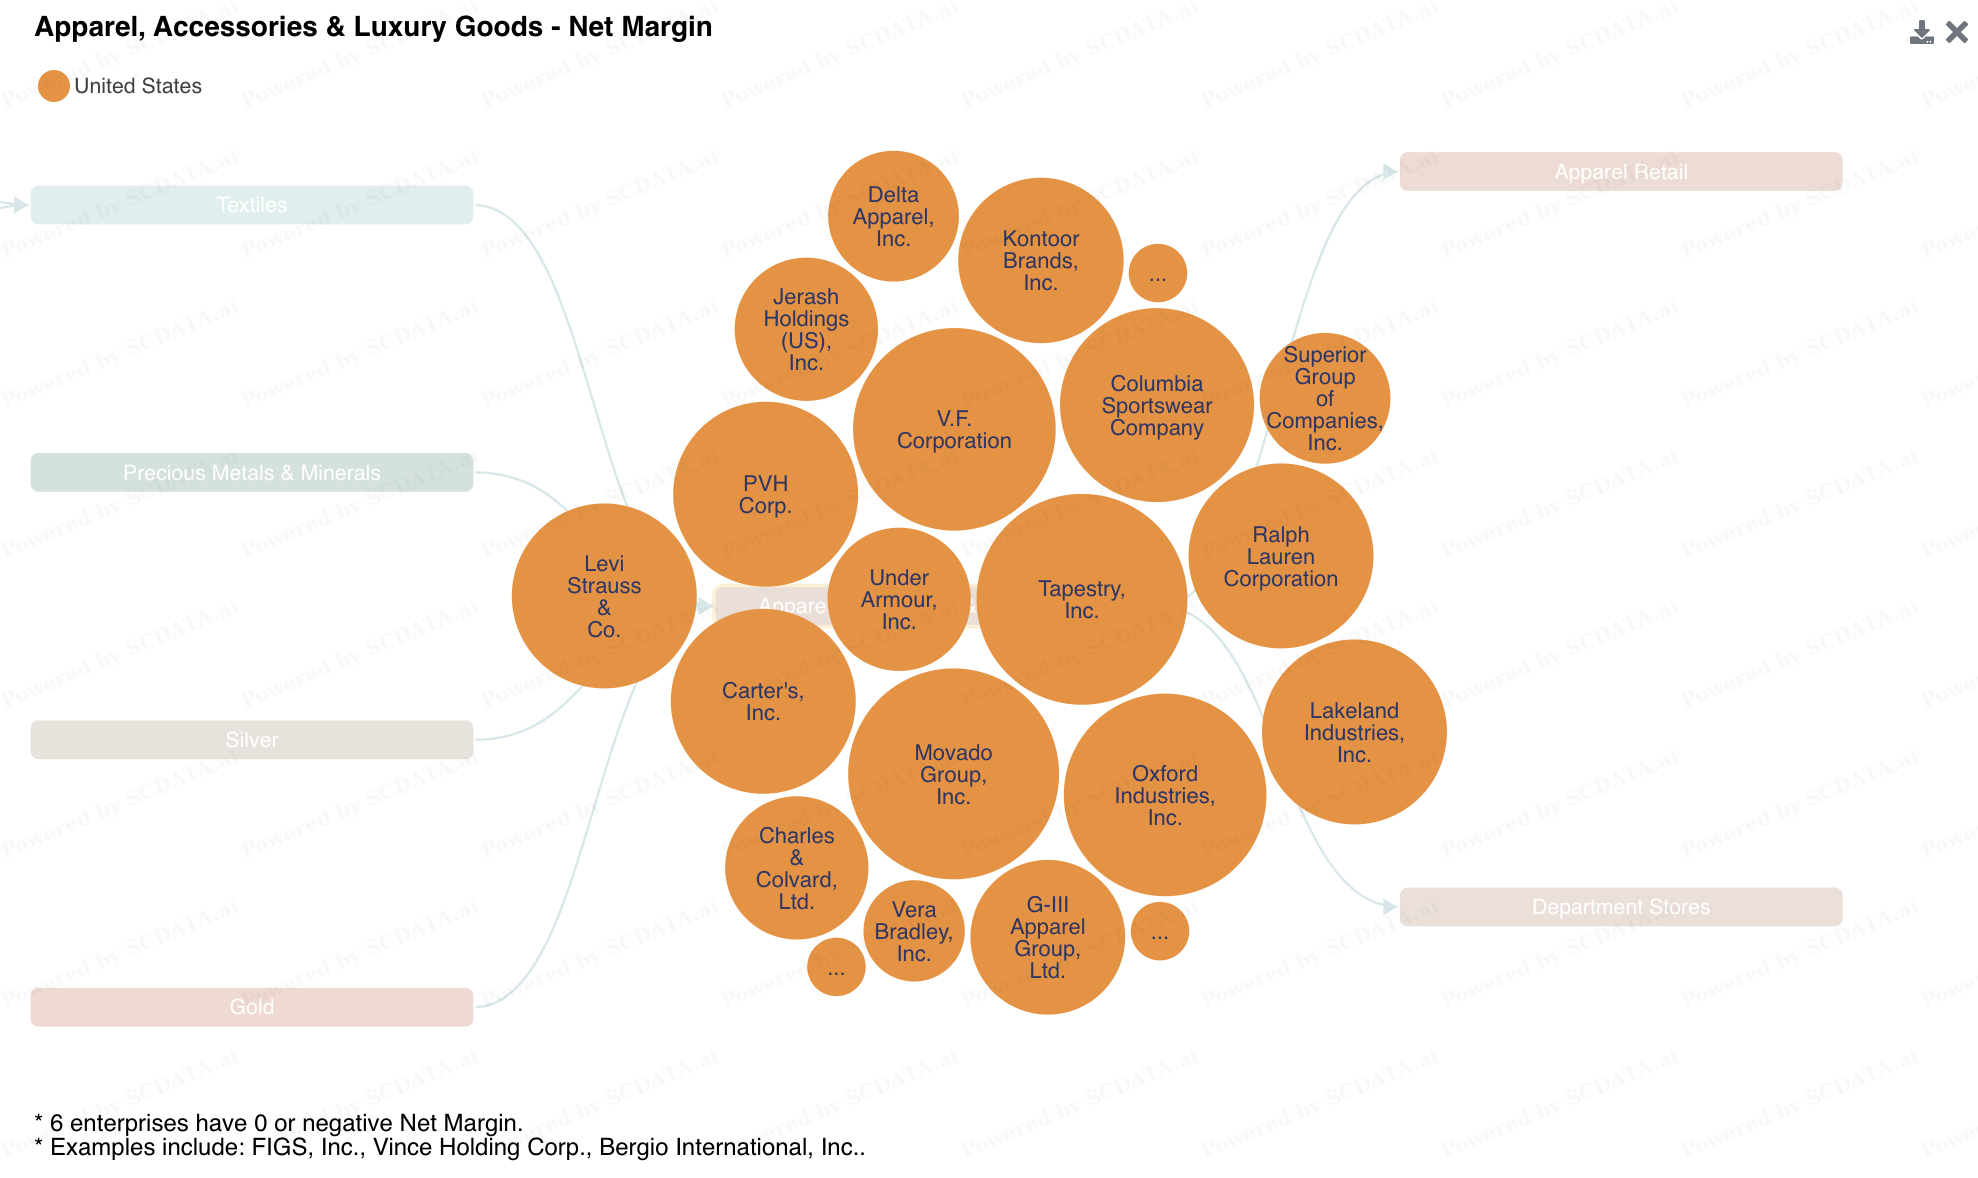
Let's see the UA's sub-industry, Apparel, Accessories & Luxury Goods. Except for the upstream textiles and precious metals, others have a positive net margin.
18/49
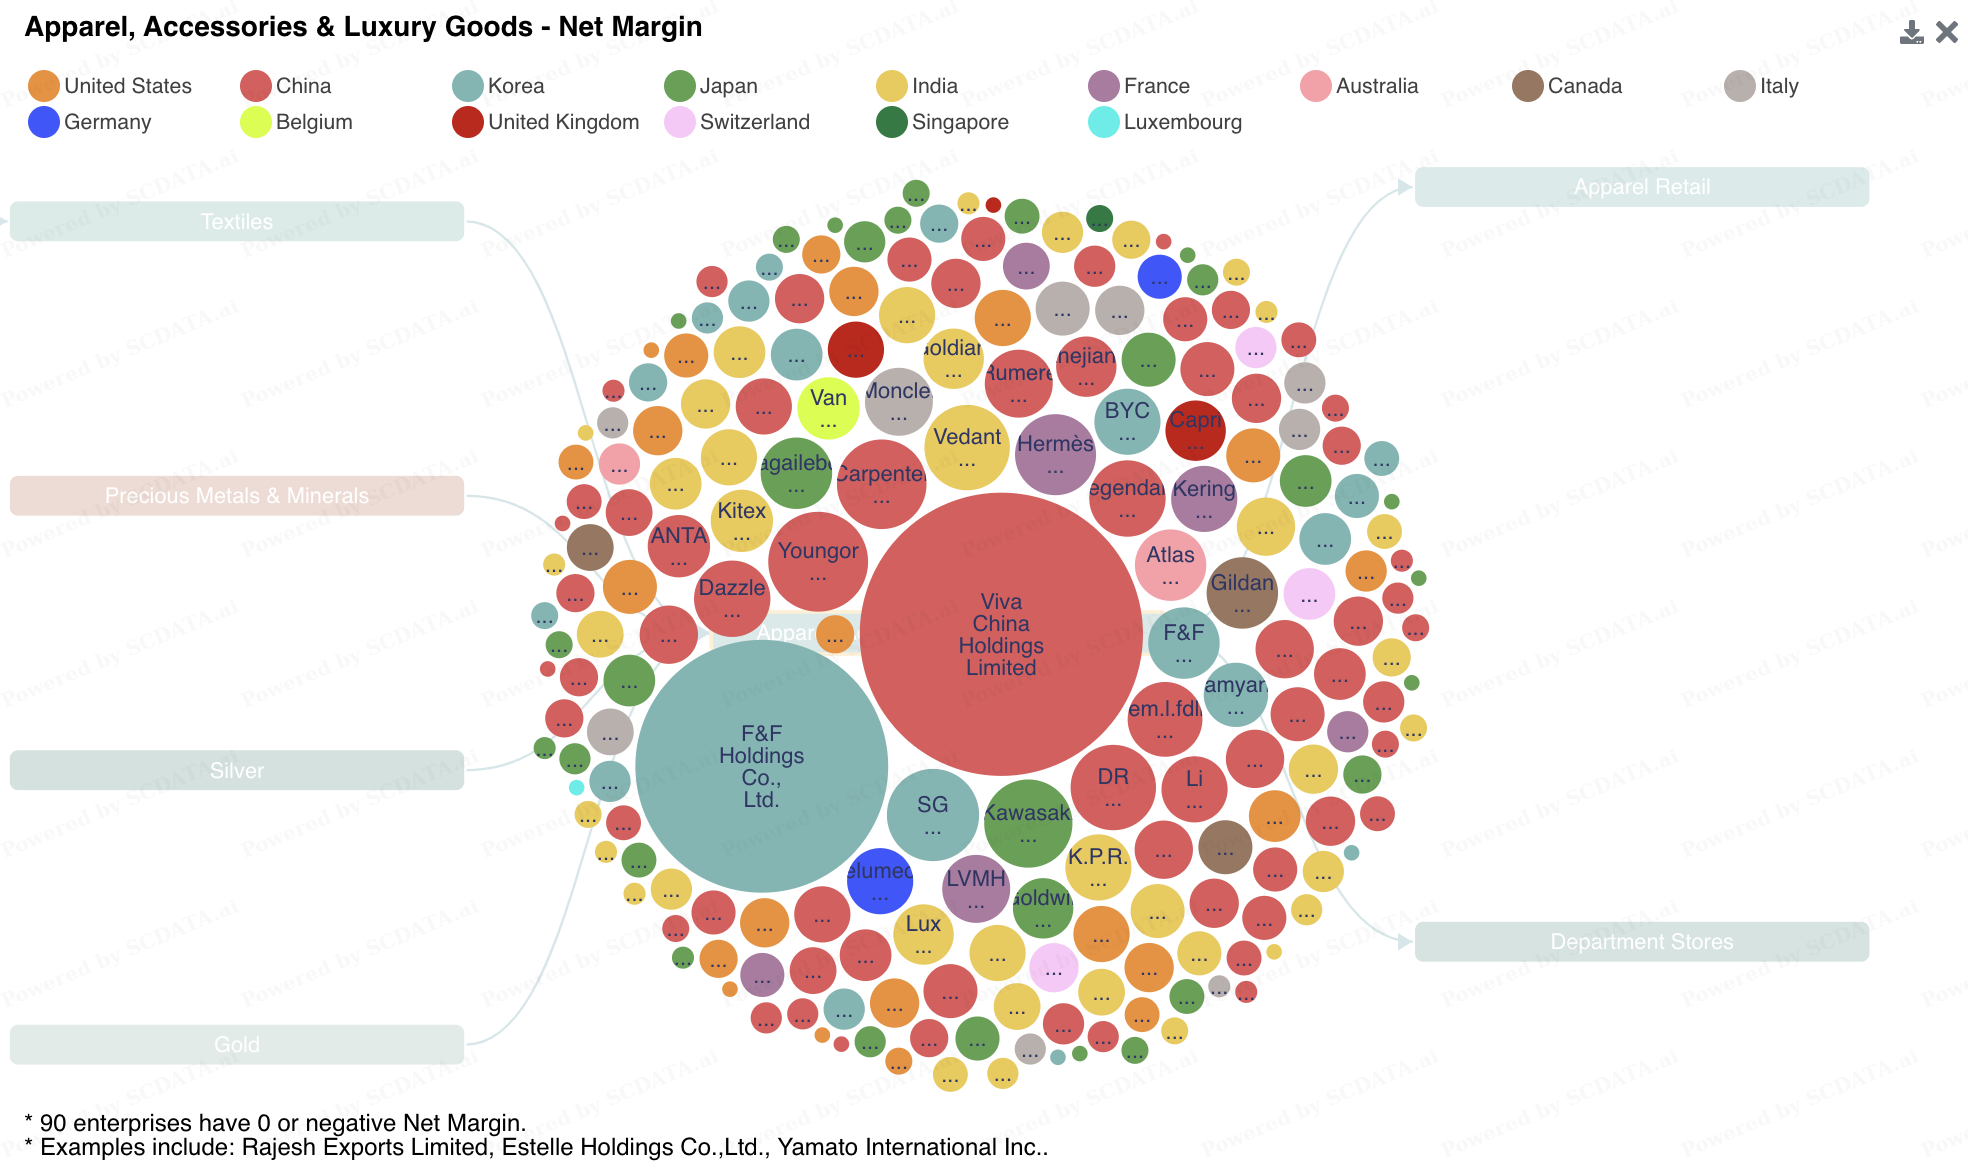
Supply Chain mapping - Net Margin (Worldwide 2021)

20
In terms of the world's apparel industry. Unlike the US market, all segments with a positive net margin. However, almost every segment's margin is lower than in the US.
20/49
Supply Chain mapping - Net Margin (Worldwide 2021)

21
On a global scale, China and Korean companies have a high net margin that cannot be ignored.
21/49
Revenue vs. Cost (US/China/Korea)

25
In the revenue vs. cost, besides choosing the US, I also chose Korean and China's companies in comparison. I chose Korea & China because both countries have high net margins on a global scale. However, the graph shows that Korea has a relatively small market. I decided to preclude it in the following analysis. And, of course, it is not a surprise that Nike has the largest revenue and costs.
25/49
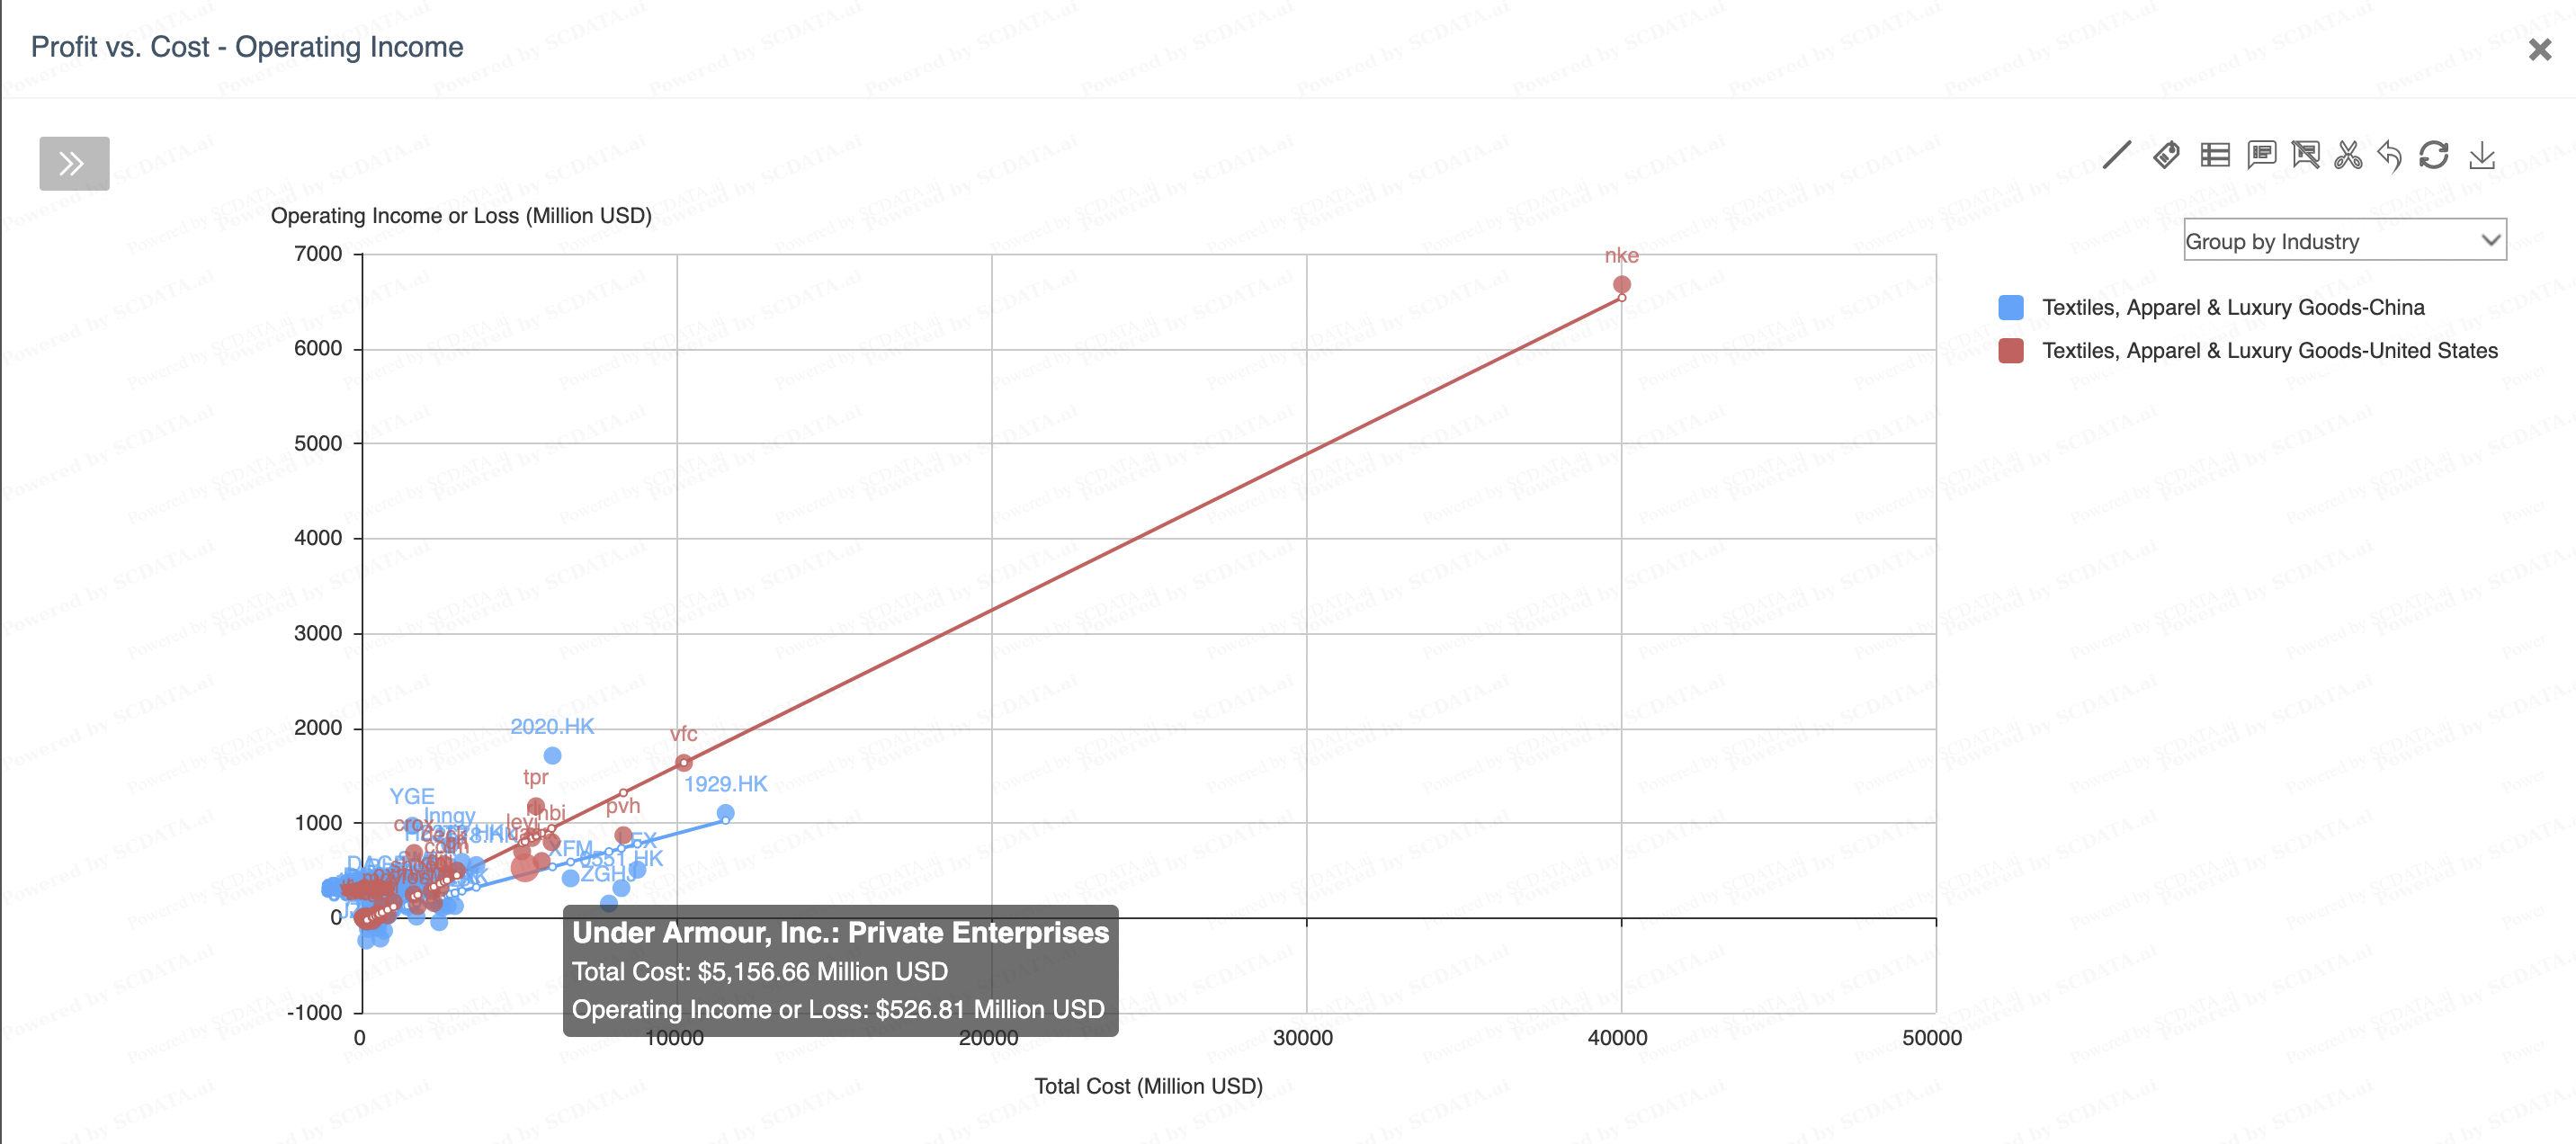
Operating Profit vs. Cost (Profit Frontier) 2021

27
There is still no significant difference in profitability since most companies are on the regression line in the US market. However, Under Armour, the company I analyzed, is slightly under the regression line. It means it spends more than other companies but generates less income.
27/49
Profit vs. Total Assets - Operating Income 2021

28
We could see how efficiently these companies utilize their assets to make money through the operating income vs. total assets analysis. Nike outperformed all other companies with lower assets to generate more money, so as Crocs. However, we could find that under armour is still under the regression line.
28/49
Operating Margin vs. Revenue 2021

29
I've decided to narrow the industry to the companies in SP500. I am making a brief intro for the companies' brands as below. I found uaa is still the worst performer among its cooperate peers.
nke - Nike
uaa - Under Armour
tpr - Tapestry - Well known as COACH
rl - Polo Ralph Lauren
vfc - Vans · The North Face · Timberland · Dickies · Supreme
pvh - Tommy Hilfiger · Calvin Klein
29/49
Return on Assets vs. Liability Asset Ratio

30
In the risk vs. return analysis, uaa performed not badly compared with others. Furthermore, pvh has the lowest liability asset ratio.
30/49
Enterprise Ranking - Total Revenue (2021)

32
In the enterprise ranking on the total revenue shows that Under Armour has the smallest revenue.
32/49
Enterprise Ranking - Net Margin

33
Although Taperstry's revenue is not higher than Nike, they tie in net margin. Once again, Under Armour is one of the least profitable company.
33/49
KPI Examination - Under Armour (2021)

35
Here's the KPI examination of Under Armour, and the population is the SP500 companies in the textiles industry. Based on previous analysis, UA has a low Net Margin and ROA performance. However, UA has a high Free Cash Flow Growth rate indicating that UA is generating increasing amounts of cash that can be used for various purposes, such as reinvesting in the business, paying off debt, or returning value to shareholders. Other indicators show an average compared with the population.
35/49
Enterprise Comparison - Size

38
Under Armour has the smallest size in every perspective of the industry.
38/49
Enterprise Comparison - Profitability

39
We also can find that UA has the smallest margins and ROA, which could explain its stock market performance.
39/49
Enterprise Trend - Size

40
Trend analysis could let us see the company's performance over time. Covid-19 impacted every company. However, Nike has the most agility; we can see they had a significant boost in 2020.
40/49
Enterprise Trend - Financial Health

41
Overall, in the enterprise trend analysis on financial health shows that V.F has the worst performance.
41/49
Value Driver Analysis - Liability Asset Ratio and Return on Assets

43
The r-square is too small to explain the correlation between the Liability asset ratio and ROA.
43/49
Revenue Breakdown - Pre-COVID (2019)

45
In the revenue breakdown, UA has lower COGS compared to Nike but its SG&A was higher than Nike before the pandemic. Saying that both figures of UA were higher than the industry's average.
45/49
Total Assets Breakdown - Pre-COVID (2019)

46
UA has a higher inventory than the industry average. Although it seems to have done well in other aspects compared to RL and Tapestry, UA still has higher COGS and SG&A costs which we found in previous slide.
46/49
Enterprise Breakdown - Detailed Assets (2021)

48
From the post-Covid assets breakdown, I found that UA has much more cash than its peers. UA is more efficient in generating cash or experiencing growth in its operations. It should utilize those cash to invest in the business.
48/49


