Competitive Intelligence and Benchmarking
Tesla and the Automotive Industry
Siddhant Khanna
Netid: sk2679
Week- 4&5 Homework

Tesla
Retail Presence: Tesla is an American car company that operates 160 retail stores in 40 US states. Apart from this the company also has a vast network of approximately 5000 Superchargers in the country.
Product Offerings: Tesla produces various models of electric cars. Tesla also installs and maintains energy systems and sells solar electricity; and offers end-to-end clean energy products, including generation, storage, and consumption.
Customer Experience: Tesla is known for its high level of customer service, Tesla sells its cars to consumers directly. Tesla has an incredibly strong understanding of who its customers are both as a whole and individually. Tesla sets the bar high for not only car sales, but customer experience in general.

1 Year comparison of Tesla (TSLA) stock price change with its competitors and S&P 500
Legend:
Tesla: Tsla (-28.11% Decline), Ford Motors: F (-18.06% Decline), General Motors: GM (+ 11.75% Increase), Toyota Motors: TM (- 11.13% Decline), S&P 500: GSPC (-0.28% Decline
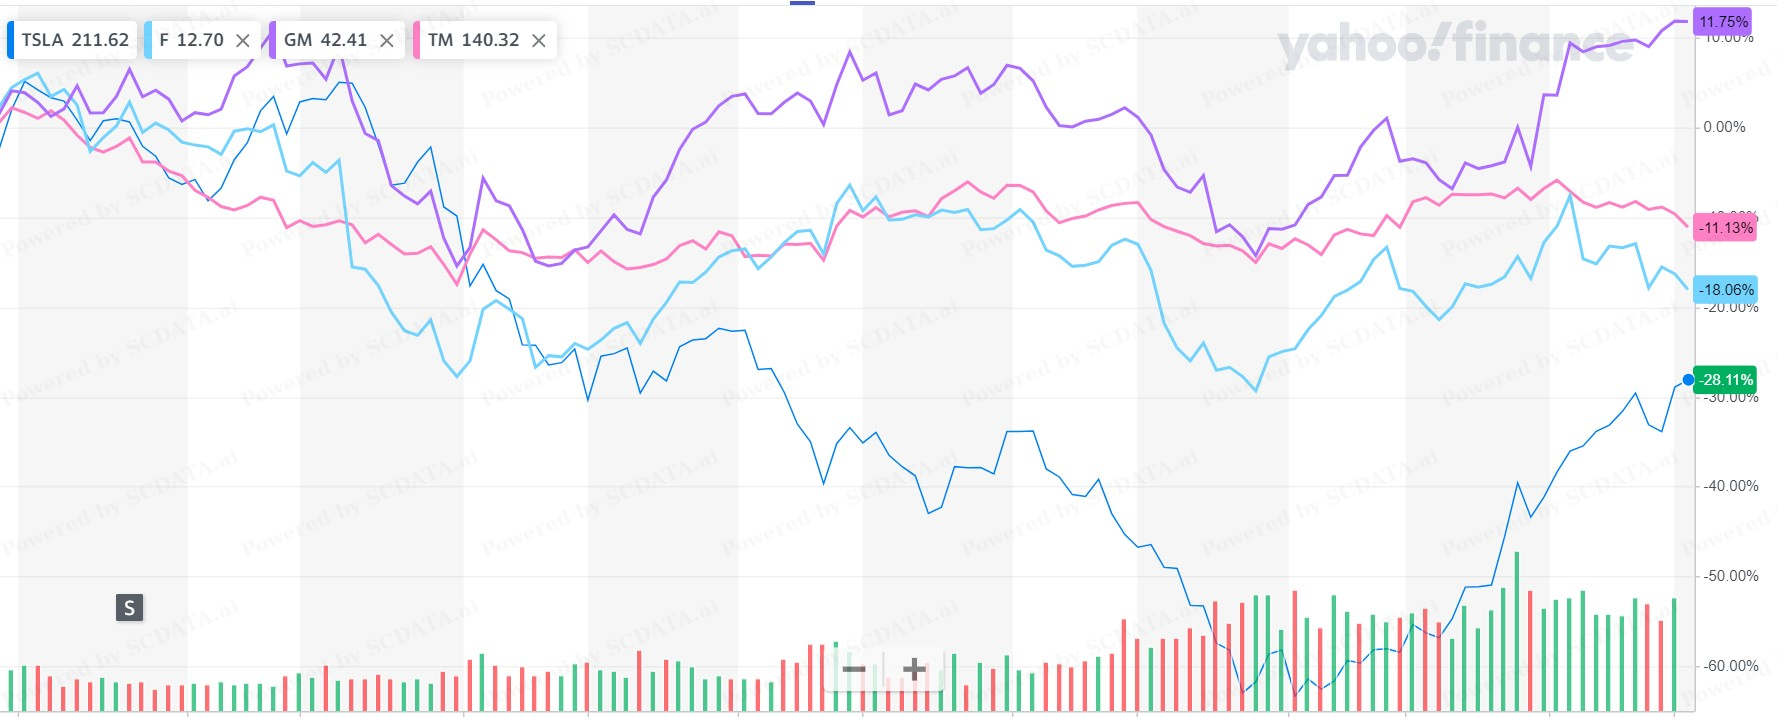
General Motors is the only stock with an increase rest other companies have a decline and Tesla has the largest decline amongst others within the year 2022-2023.

Competitive Intelligence and Benchmarking
Industry Analysis: Asses industry potential and risk by industry trend, competition intensity and value chain analysis to further discover the market potential, risk and trend.

Phase 1
Industry Analysis
Step 1: Industry Trend
Step 2: Concentration and Competition Intensity
Step 3 : Value Chain Analysis

Step 1 - Industry Trend Analysis
Industry Trend Analysis of Size for four sub industry in the Automobile Category.
Industry Trend Analysis of Profitability for four sub industry in the Automobile Category.

Industry Trend Analysis of Speciality Retail and Automotive Industry
We can see that Speciality Retail is bigger in size and has higher total revenue, however is almost equal to Multiline Retail, Autmobile Industry in Median Gross and Operating Margin.
We also notice that Proportion of Profitable companies is much high in Multiline Retail than Specialty Retail, making it a better industry.

Step 2 - Concentration and Competition Intensity
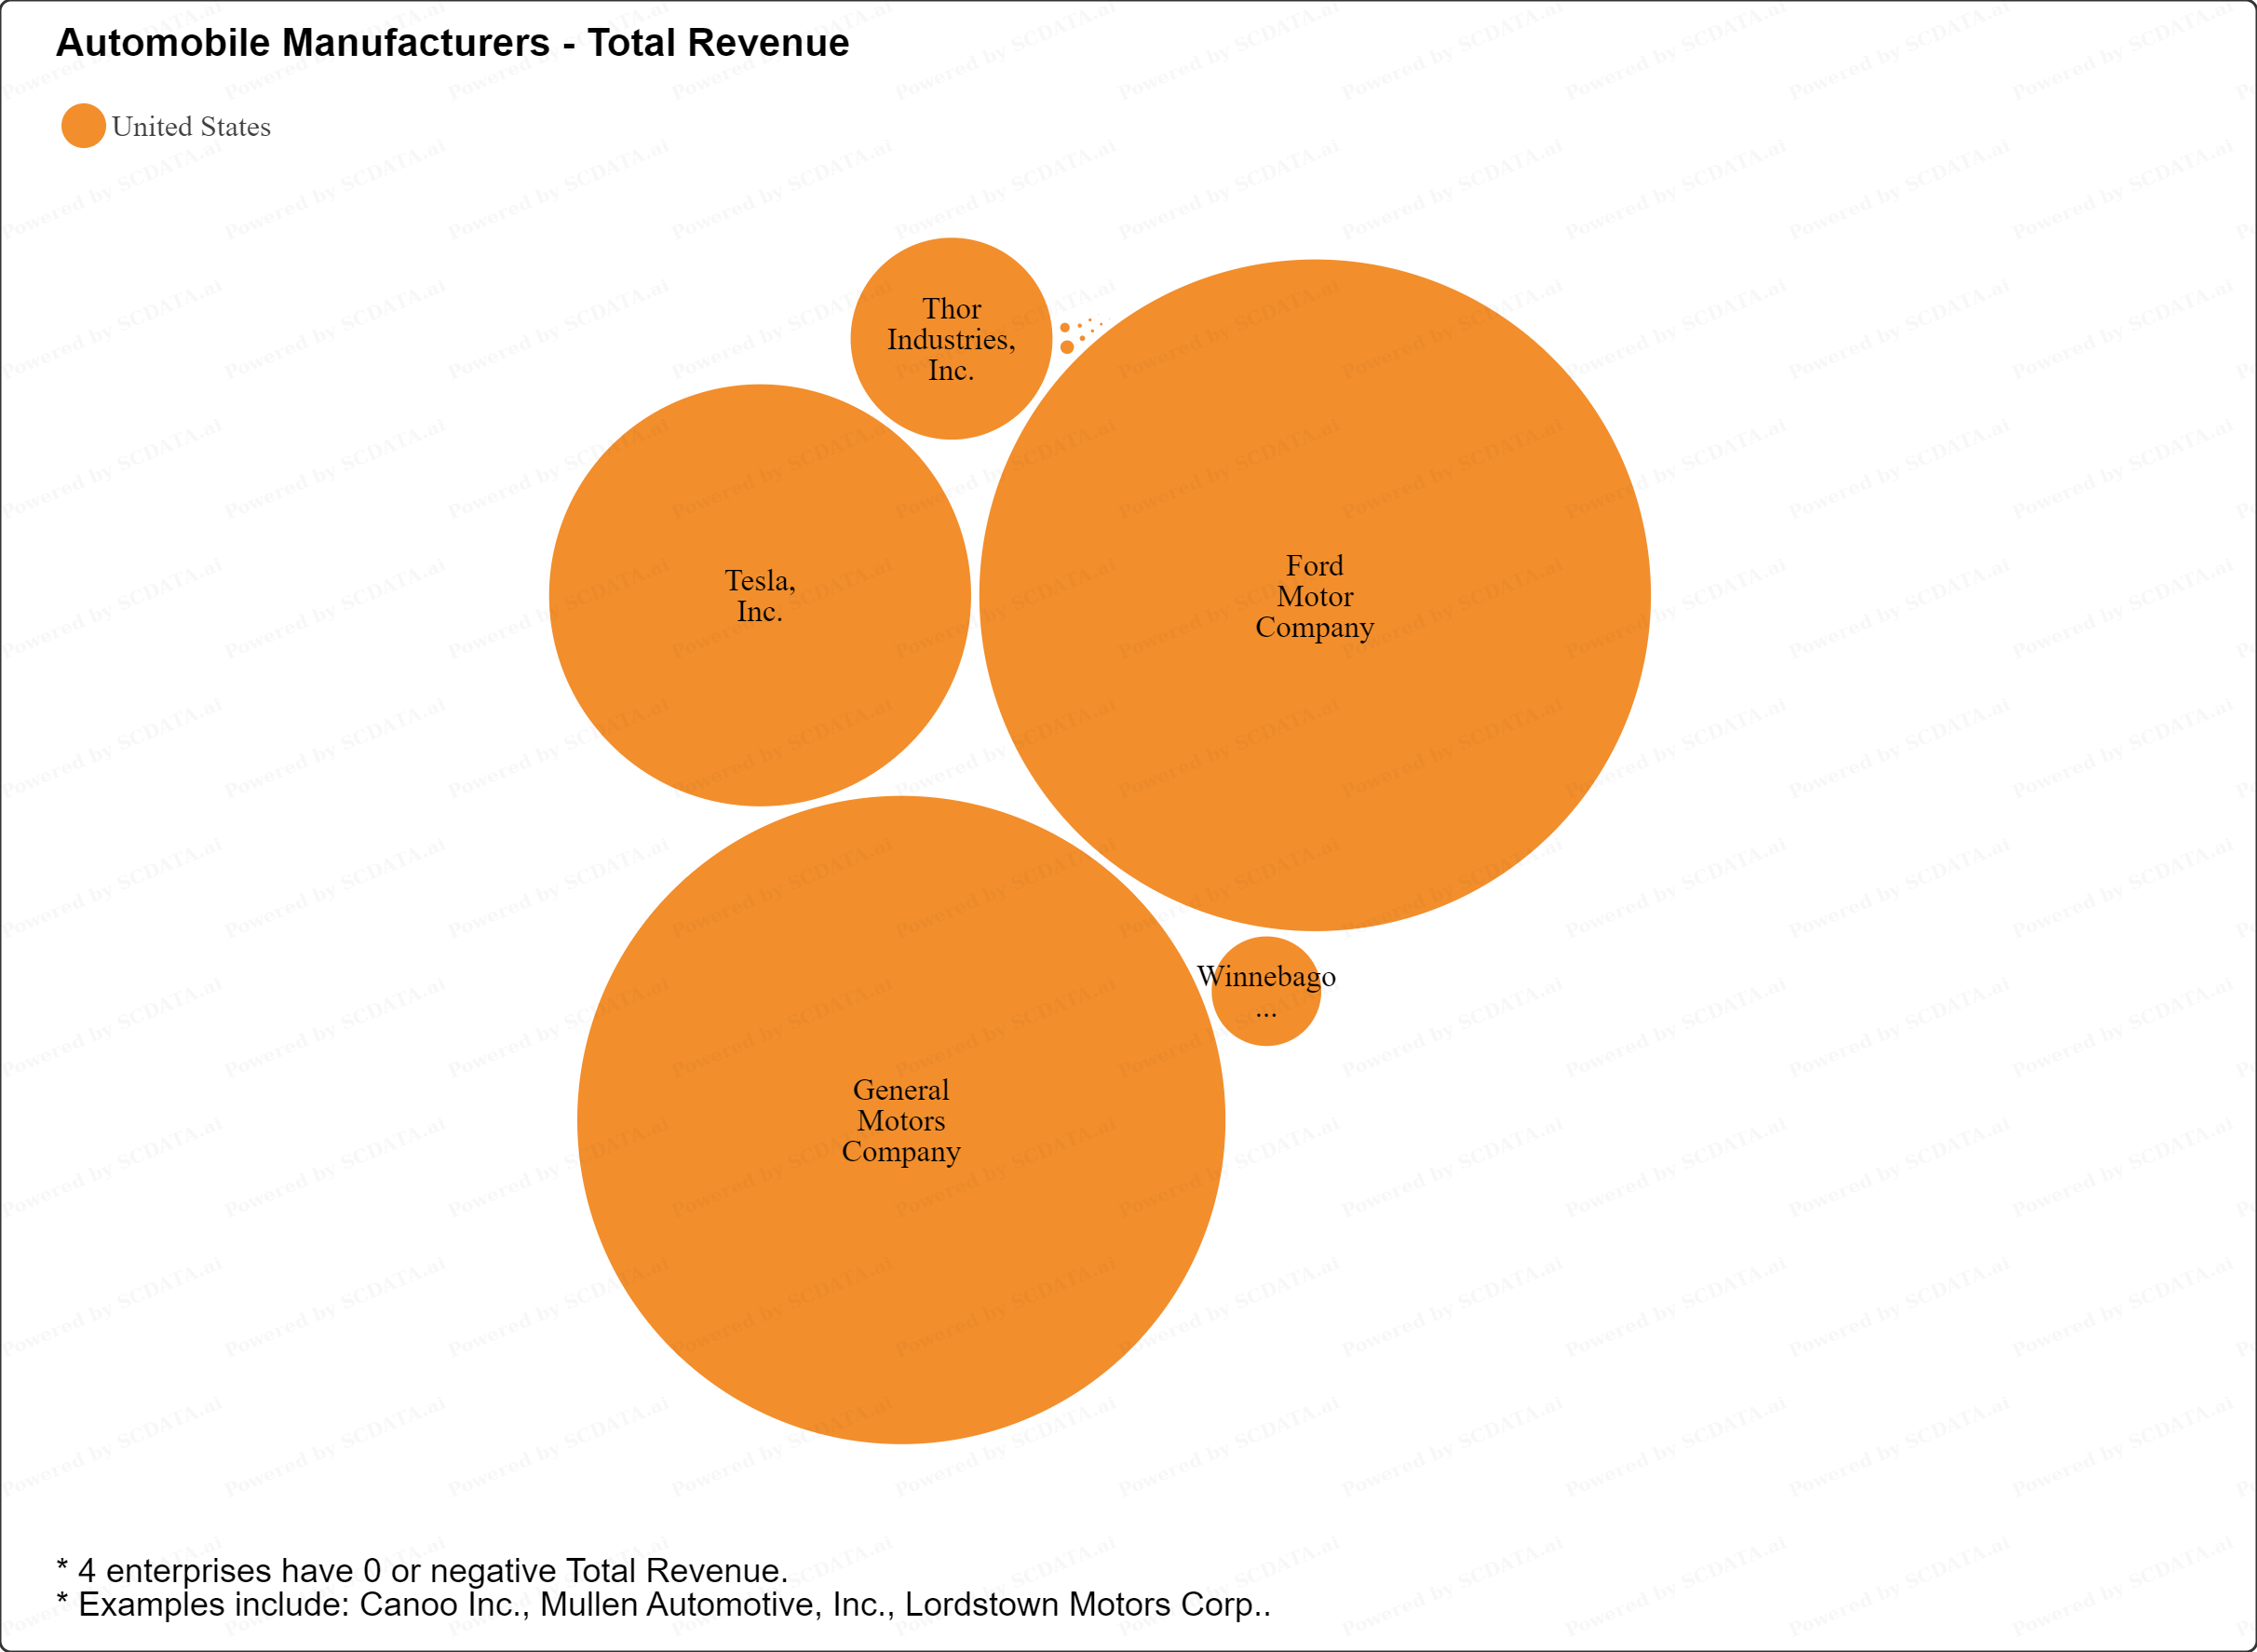
Market Share Analysis by Total Revenue for each industry.
Competition Intensity - Four Firm Concentration Ratio

Competition Intensity - Market Share Analysis by Total Revenue (Multi Line Retail)
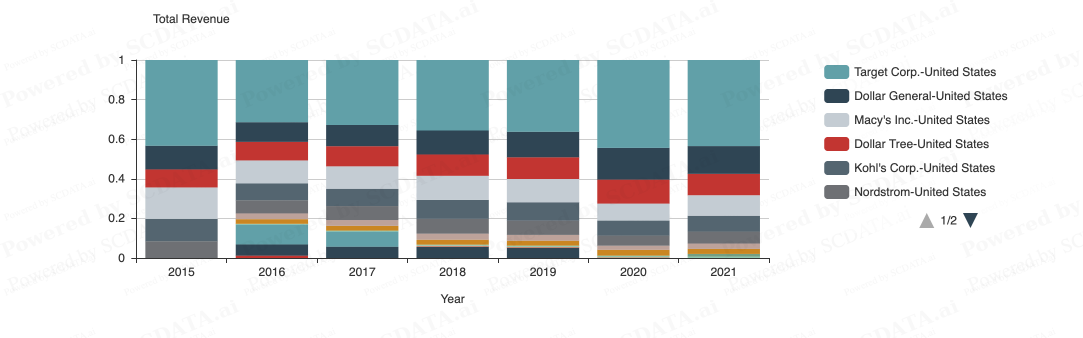

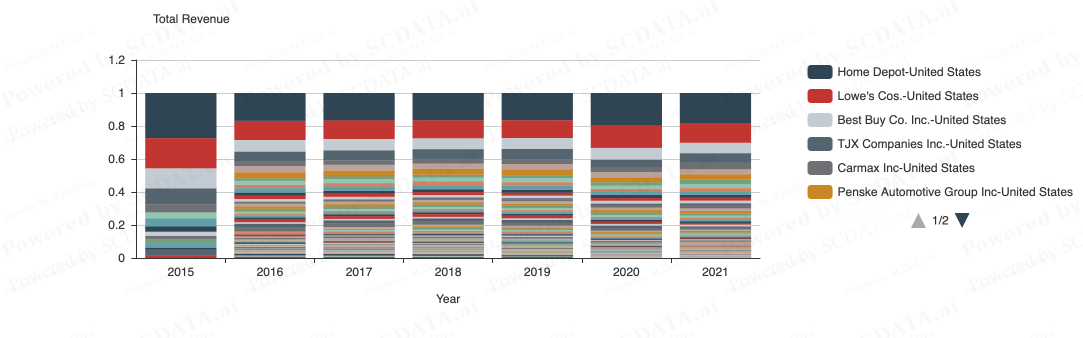
Competition Intensity - Market Share Analysis by Total Revenue (Speciality Retail)

Competition and Tesla KPI Analysis

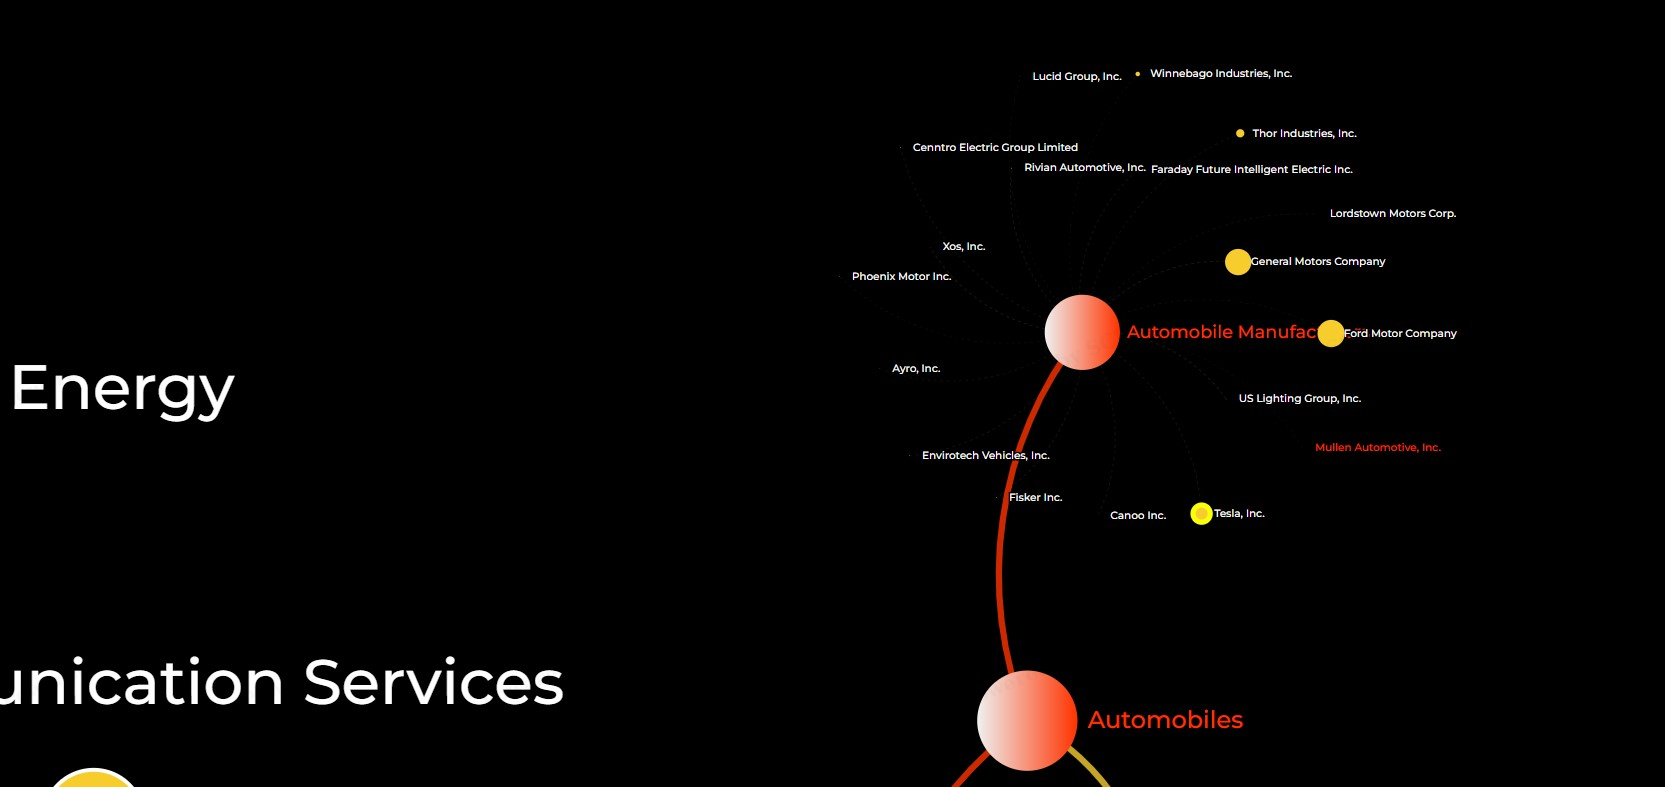
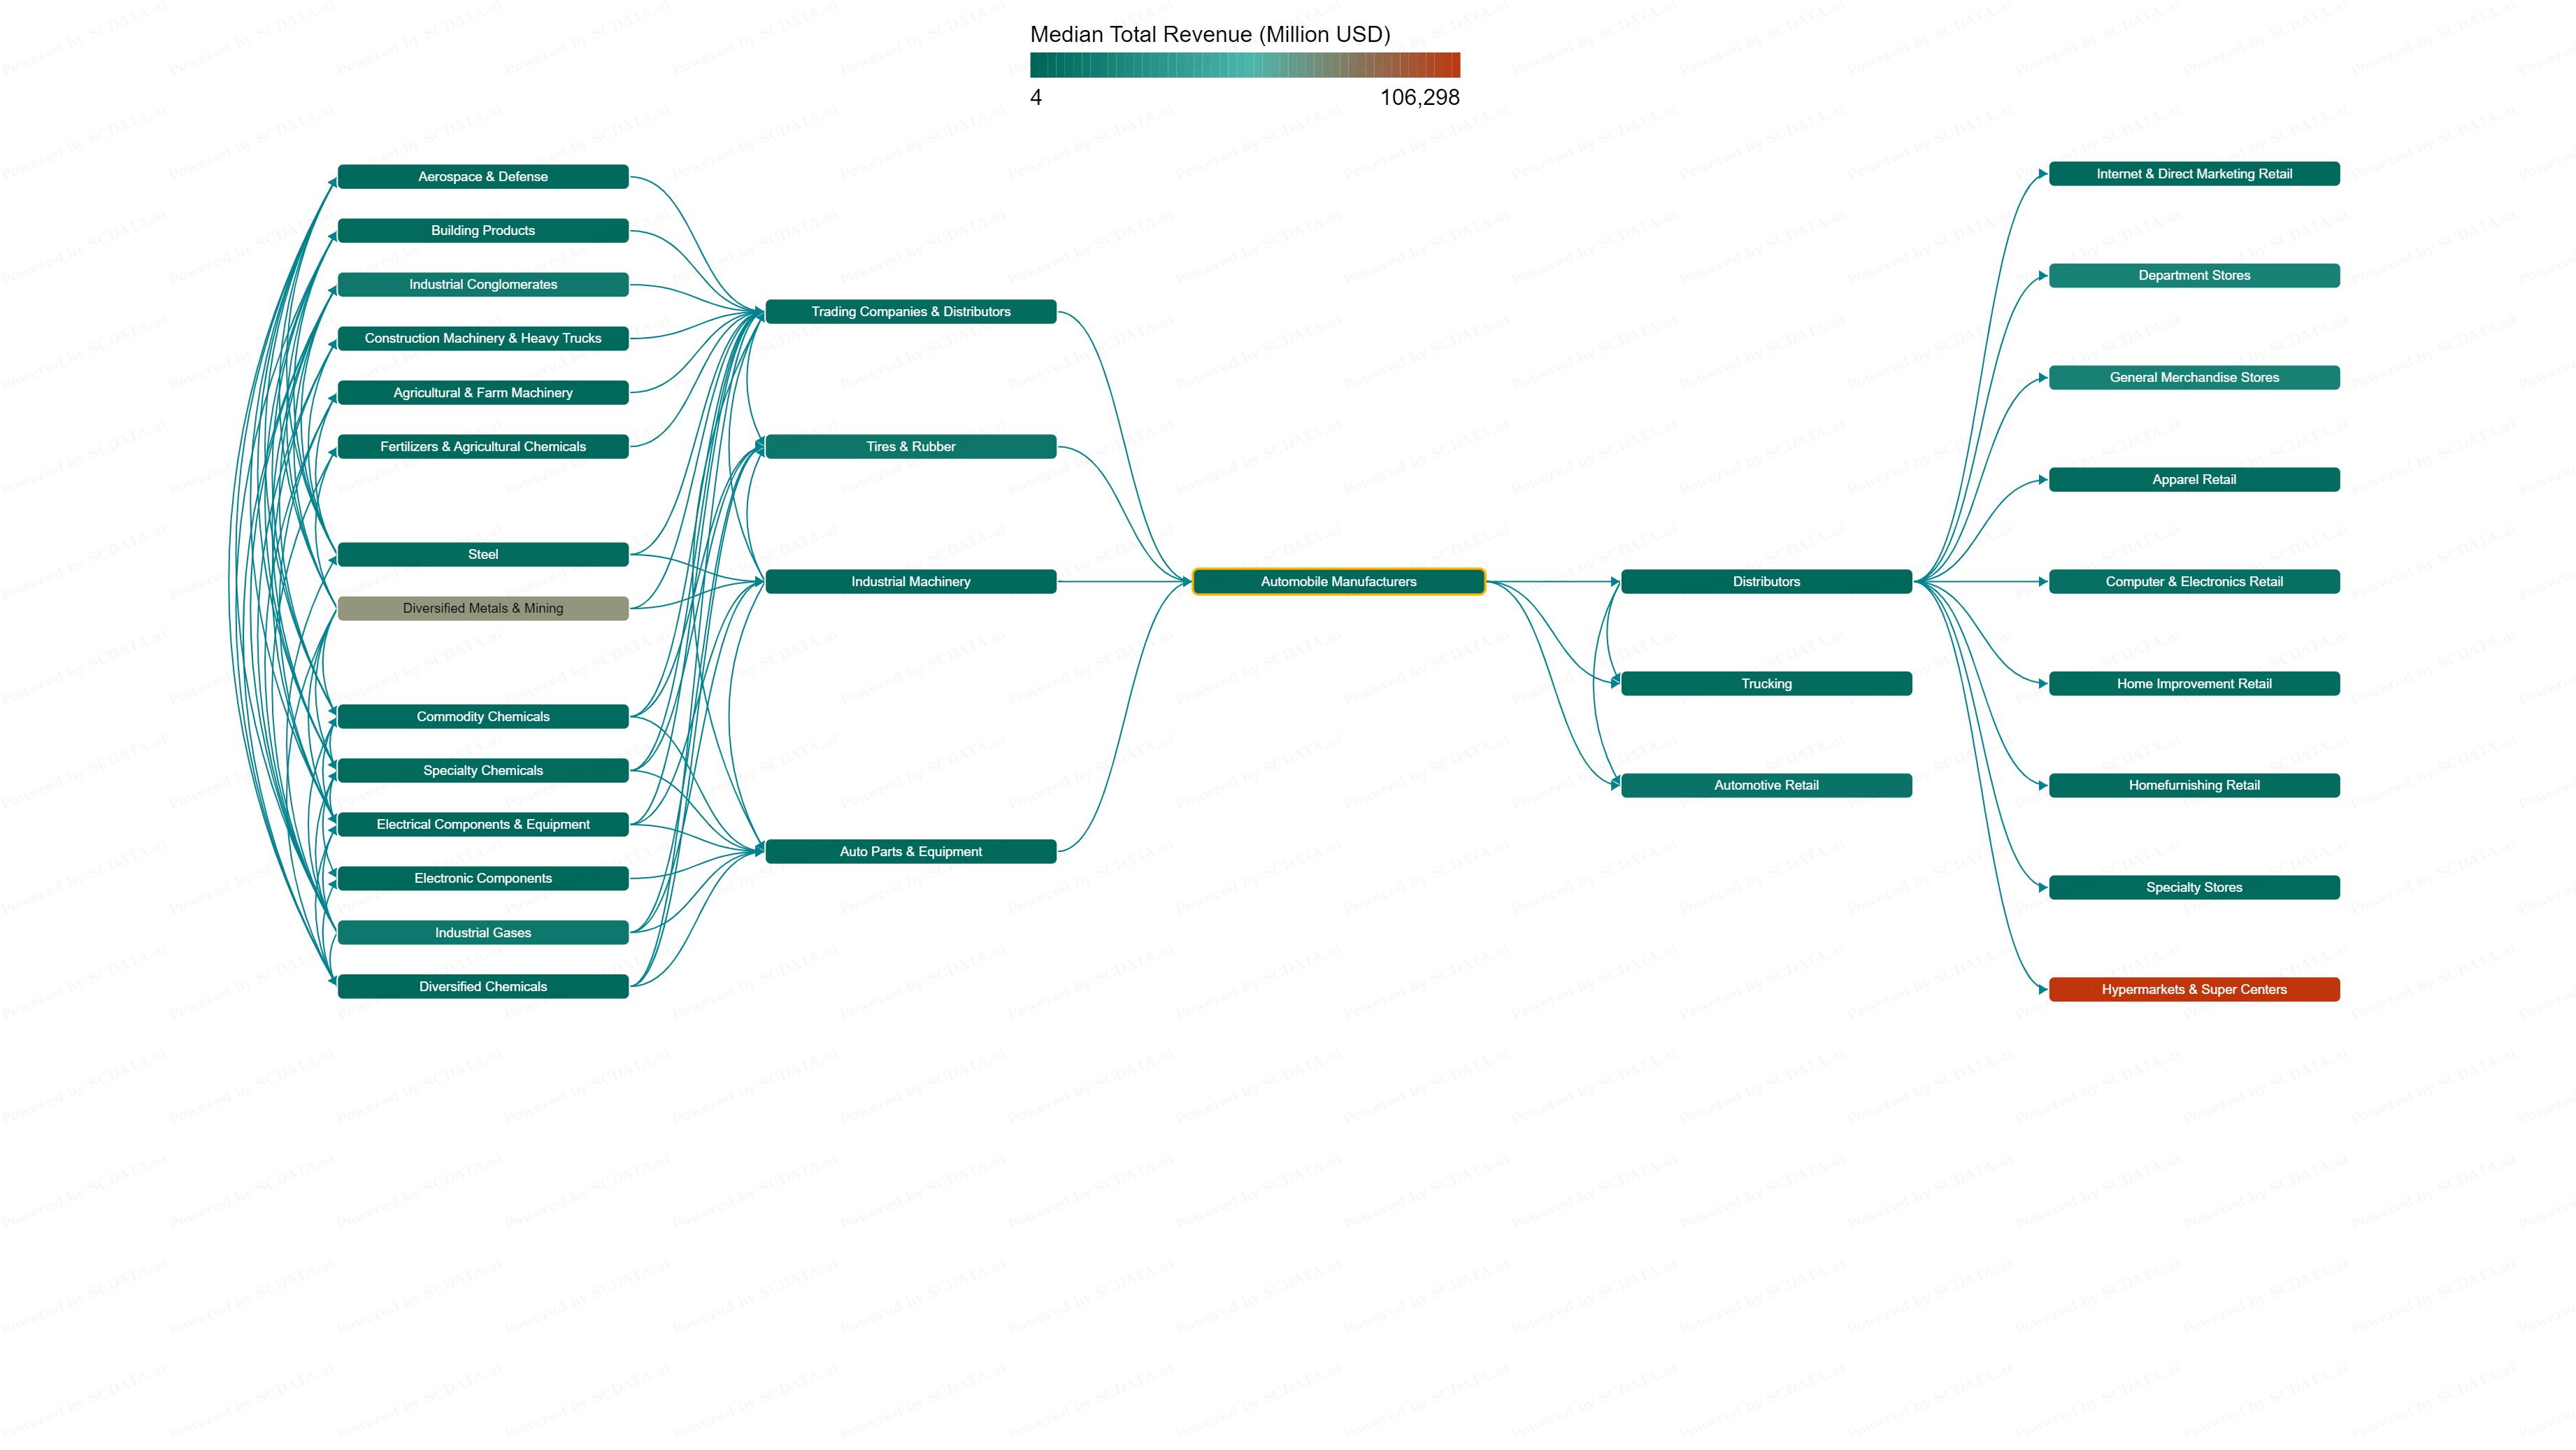
Step 3 - Value Chain Analysis
Supply Chain Mapping (Net Margin) - Global

Phase 2
Competition Position Analysis
Step 1: Profit Frontier
Step 2: Enterprise Ranking
Step 3: Key Performance Indicator Examination

Step 1 - Profit Frontier
Most profitable companies in each revenue class. Competition positioning in terms of Profitability.
Actions:

Conclusion (Step 1)

Step 2 - Enterprise Ranking
Company placement against other companies using varied metrics.
We will focus on Tesla Inc (TSLA), Ford Motors (F), General Motors (GM), Harley Davidson () and Toyota Motors(TM).
Actions: (Enterprise Ranking)

Step 3 - Key Performance Indicator (KPI) Examination
A KPI examination is important because it provides insights into the performance of a business or organization, and enables decision-makers to make informed decisions based on objective data. It helps to identify areas that are performing well, as well as areas that may require attention and improvement. By focusing on the right KPIs, businesses can improve their performance, enhance customer satisfaction, and achieve their strategic objectives.
Actions:

Phase 3
Enterprise Diagnosis
Step 1: Strengths and Weaknesses
Step 2: Value Driver Analysis
Step 3: Breakdown Analysis

Step 1- Strengths and Weaknesses
Actions:

Step 2 - Value Driver Analysis
Actions:

Step 3 - Breakdown Analysis
Looking at firm's COGS, SG&A Expenses, R&D, etc to compare with the industry. This could help in figuring out where a company has more spending when comparing with other companies in the same industry. (Jain, 2023)
Actions:

Conclusion
Phase 3
Strengths and Weaknesses: It is clear that Tesla's high risk, high Liability to Asset Ratio, and increased long-term debt was the leading cause for the decline in profits in the year 2021.
Value Driver Analysis: Similar to the above analysis, Tesla has high Liability to Asset Ratio, while Harley Davidson's sudden increase in Return on assets remains a mystery.
Breakdown Analysis: I have done two analyses, Enterprise Breakdown on Revenue and Detailed Assets.

Summary/Recommendations


