Benchmark by KPI -- USA

1
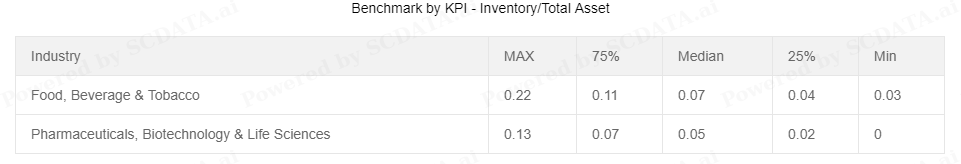
In the USA, in the Food, Beverage & Tobacco industry, the maximum level of inventory
to total asset ratio is about 0.22, while in the Pharmaceuticals, Biotechnology& Life
Sciences industry, the maximum level of inventory to total asset ratio is about 0.13,
which is slightly lower than the Food, Beverage & Tobacco industry. this means that
compared with Pharmaceuticals, Biotechnology& Life Sciences industry, Food,
Beverage & Tobacco industry has larger portion of money restrained by inventory.
Maybe this is because the equipment producing health care-related products is more
expensive than the equipment producing food, beverage, and tobacco. When it comes to
the minimum inventory to total asset ratio, the Food, Beverage & Tobacco industry is
about 0.03, while the Pharmaceuticals, Biotechnology& Life Sciences industry is zero.
Maybe because food and beverage are so necessary in our daily life that the minimum
inventory of that is above zero.
1/22
Benchmark by KPI -- China

2
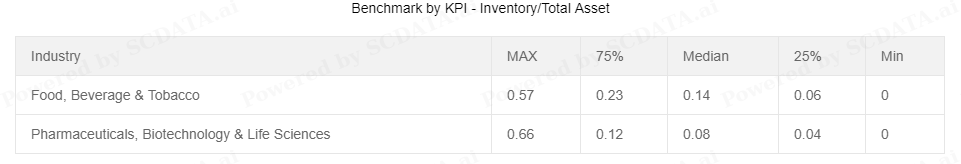
In China, in the Food, Beverage & Tobacco industry, the maximum level of inventory to
total asset ratio is about 0.57, while in the Pharmaceuticals, Biotechnology& Life
Sciences industry, the maximum level of inventory to total asset ratio is about 0.66,
which is slightly higher than the Food, Beverage & Tobacco industry. When it comes to
the minimum inventory to total asset ratio, the Food, Beverage & Tobacco industry and
the Pharmaceuticals, Biotechnology& Life Sciences industry are both zero. Maybe
because food and beverage are so necessary in our daily life that the minimum inventory
of that is above zero. When compared with USA, China has much higher maximum
inventory to total asset ratio, probably because China has much larger population and the
information exchange in China is not effect enough to bring down the bullwhip effect forsome certain products or some companies. The minimum inventory level is zero may
because for some really popular food, beverage, or tobacco, they can be produced very
quickly for the replenishment and their shelf life is too short to be kept in inventory.
2/22
Industrial Trend

3
In China, in the Food, Beverage & Tobacco industry, the maximum level of inventory to
total asset ratio is about 0.57, while in the Pharmaceuticals, Biotechnology& Life
Sciences industry, the maximum level of inventory to total asset ratio is about 0.66,
which is slightly higher than the Food, Beverage & Tobacco industry. When it comes to
the minimum inventory to total asset ratio, the Food, Beverage & Tobacco industry and
the Pharmaceuticals, Biotechnology& Life Sciences industry are both zero. Maybe
because food and beverage are so necessary in our daily life that the minimum inventory
of that is above zero. When compared with USA, China has much higher maximum
inventory to total asset ratio, probably because China has much larger population and the
information exchange in China is not effect enough to bring down the bullwhip effect forsome certain products or some companies. The minimum inventory level is zero may
because for some really popular food, beverage, or tobacco, they can be produced very
quickly for the replenishment and their shelf life is too short to be kept in inventory.
3/22
Industrial Trend

4
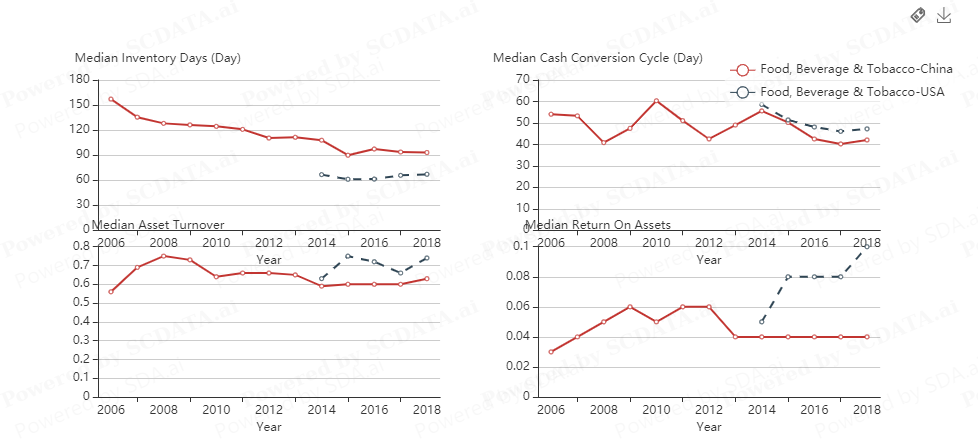
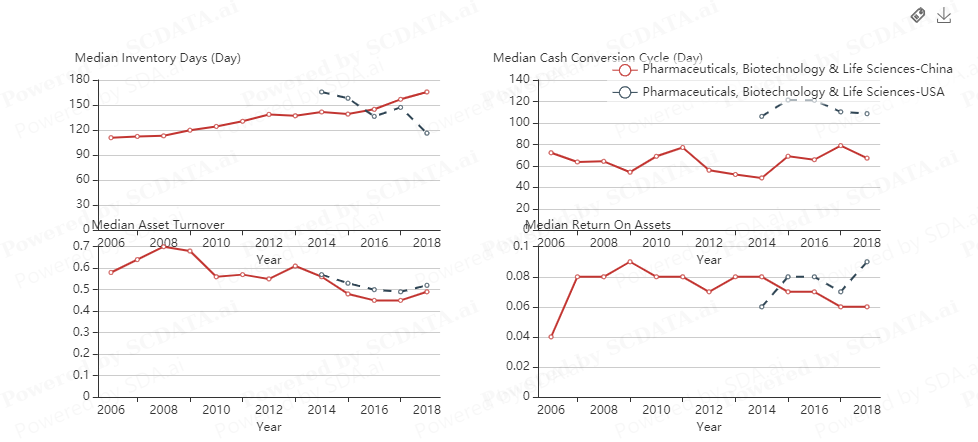
In Pharmaceuticals, Biotechnology& Life Sciences industry, for Median Asset Turnover,
China and USA have very similar index. For Median Return On Assets, USA’s index ishigher than China’s, except in about 2013. For Median Inventory Days, USA has a lower
index than China, except in 2013. This shows that when a country has a lower Median
Inventory Days, it usually has a higher Median Cash Conversion Cycle, Median Asset
Turnover, and Median Return On Asset. This is because if you sell your products more
quickly, you can convert the inventory to cash more quickly, and your profitability is
higher, because you save some money spent on inventory management.
4/22
Industrial Trend

5
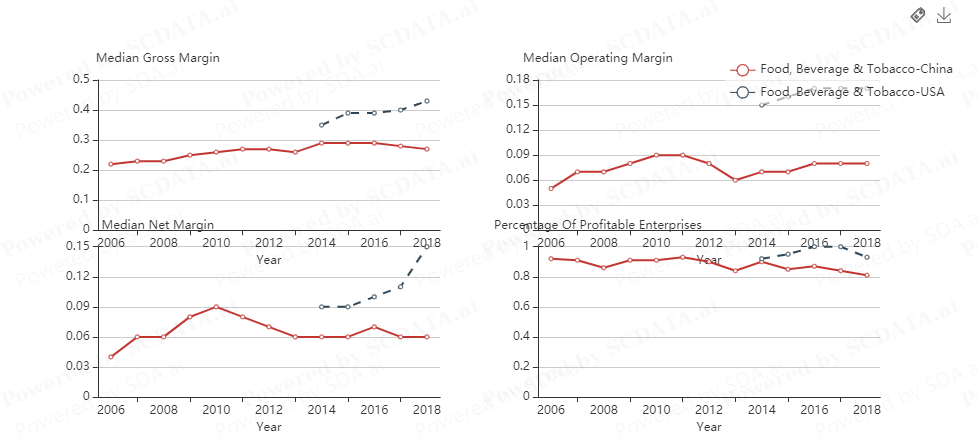
For Median Gross Margin, Median Operating Margin, Median Net Margin, and
Percentage Of Profitable Enterprises, USA’s index is always higher China’s. This shows
that on average American companies are more profitable than Chinese companies, and
American companies run better. Also, from 2017 to 2018, American Median Net Margin
has a sharp increase, which means that in about 2017, American food, beverage and
tobacco companies suddenly generate higher profits than ever. The percentage of
profitable enterprises for China and USA is both high—about 90 percent or even 100
percent.
5/22
Industrial Trend

6
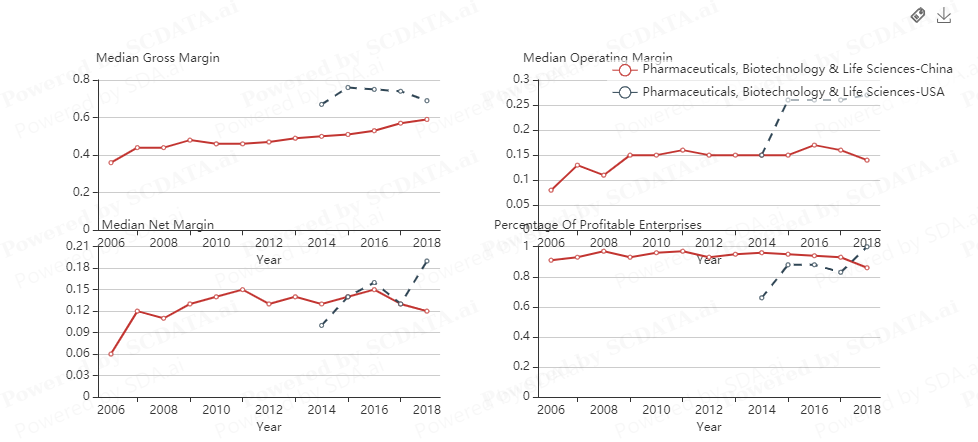
In Pharmaceuticals, Biotechnology& Life Sciences industry, American Median Gross
Margin and Median Operation Margin are both higher than Chinese. As for Median Net
Margin and Percentage Of Profitable Enterprises, in 2018, American index suddenly
surpasses Chinese index.
6/22
Industrial Comparison -- USA

7
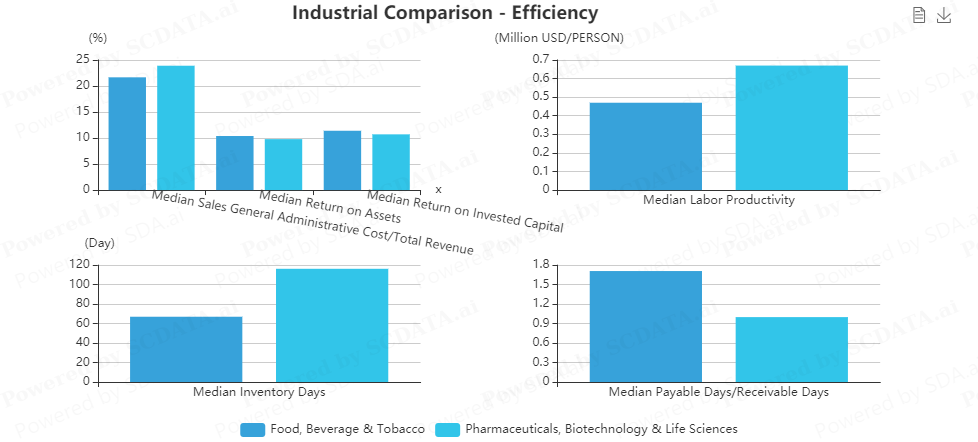
For the return rate, the two industries are very similar, which means that the profitability
of these two industries is very similar. For the Median Labor Productivity, the
Pharmaceuticals, Biotechnology& Life Sciences industry is higher, so people working in
Pharmaceuticals, Biotechnology& Life Sciences industry are more efficiently than
people working in Food, Beverage & Tobacco industry. For the Median Inventory Days,
the days of Pharmaceuticals, Biotechnology& Life Sciences industry is almost twice as
the days of Food, Beverage & Tobacco industry, which means that for Pharmaceuticals,
Biotechnology& Life Sciences industry, the inventory stays longer in the warehouse. As
for Median Payable Days/ Receivable Days, Food, Beverage & Tobacco industry has
higher Payable Days, while Pharmaceuticals, Biotechnology& Life Sciences industry
lower payable days, which means that the Food, Beverage & Tobacco industry get money
more quickly, and Pharmaceuticals, Biotechnology& Life Sciences industry pay money
more quickly and get money more slowly
7/22
Industrial Comparison--China

8
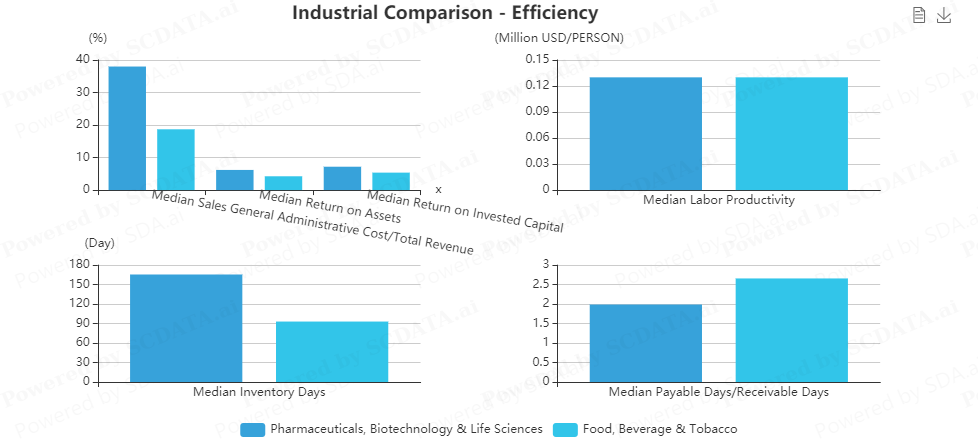
In China, the Median Sales General Administrative Cost to Total Revenue is much higher
than in Pharmaceuticals, Biotechnology& Life Sciences industry than in Food, Beverage
& Tobacco industry, which means that Pharmaceuticals, Biotechnology& Life Sciences
industry needs to spend more money in administrative activities. As for Median Return
on Assets and Median Return on Invested Capital, the two industries are very similar,
which means that their profitability is very similar. The Median Labor Productivity for
the two industries are almost the same, so the workers from both industries are equally
efficient. However, the Median Labor Productivity for both industries in China is much
lower than in America, which may be because USA has more advanced equipment than
China. The Median Inventory Days is much more higher in Pharmaceuticals,
Biotechnology& Life Sciences industry than in Food, Beverage, and Tobacco industry,
which means that for Pharmaceuticals, Biotechnology& Life Sciences industry, the
inventory stays longer in the warehouse. Also, Chinese Median Inventory Days is 1.5
times of American index, so for the two industries, China keep inventories longer than
USA. As for Median Payable Days/ Receivable Days, for both industries, the payable
days are longer than receivable days.
8/22
Value Driver Analysis -- USA, Food, Beverage & Tobacco

9
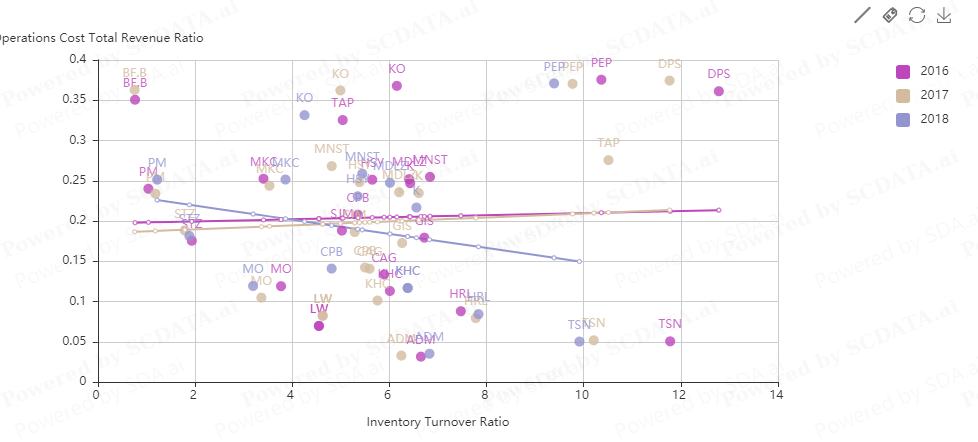
In USA, in 2017 and 2016, in the Food, Beverage, and Tobacco industry, the operations
cost total revenue ratio is positively related to inventory ratio, while in 2018, the
operations cost total revenue ratio is negatively related to inventory ratio. This may be
because in 2016 and 2017, order process costs more than keeping inventories, and even
though companies with higher inventory turnover have less inventory to manage, they
also have less negotiation power against their suppliers because they buy smaller volume
each time. However in 2018, it's more cost-efficient to keep lower inventory.
9/22
Value Driver Analysis -- USA, Food, Beverage & Tobacco

10
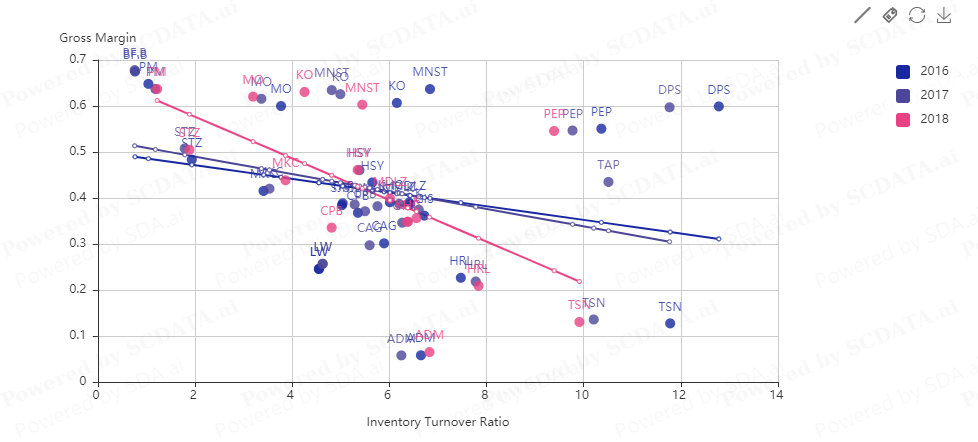
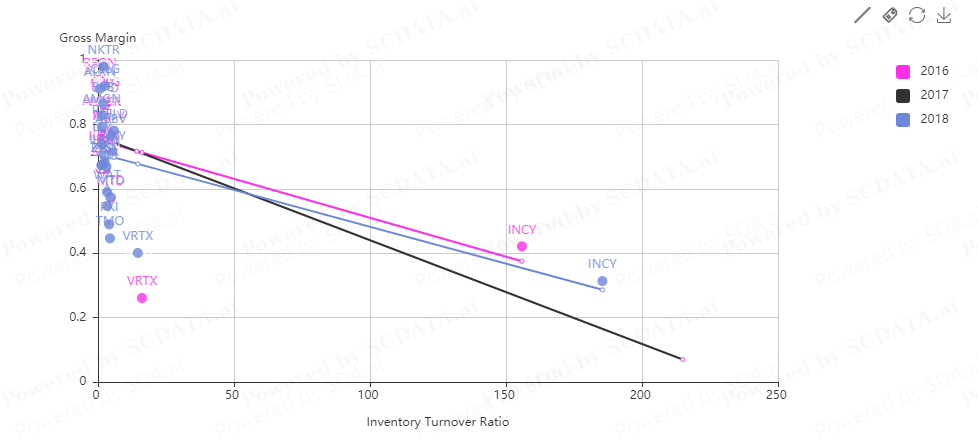
In USA, in Food, Beverage & Tobacco, and in all the three years, the gross margin is
negatively related to Inventory Turnover Ratio, which means that the more quickly the
companies replenish their inventory, the more profitable the companies are. If the
companies’ products are popular, then they will make profits.
10/22
Value Driver Analysis-- USA, Food, Beverage & Tobacco

11
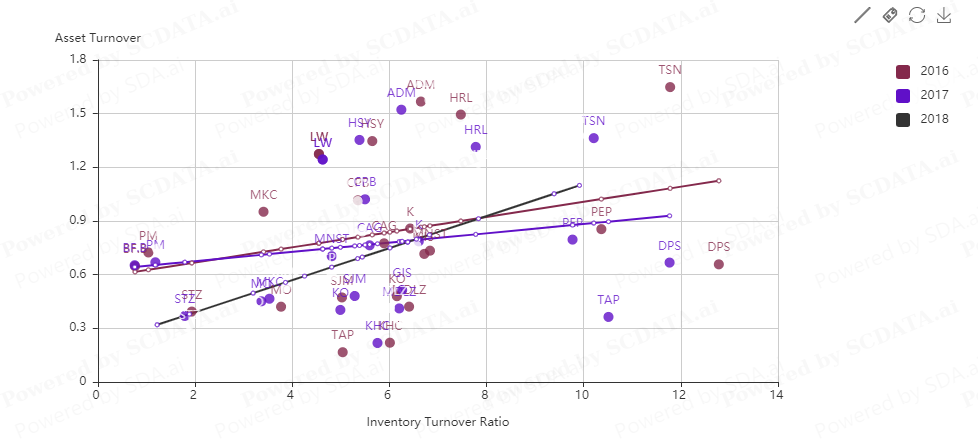
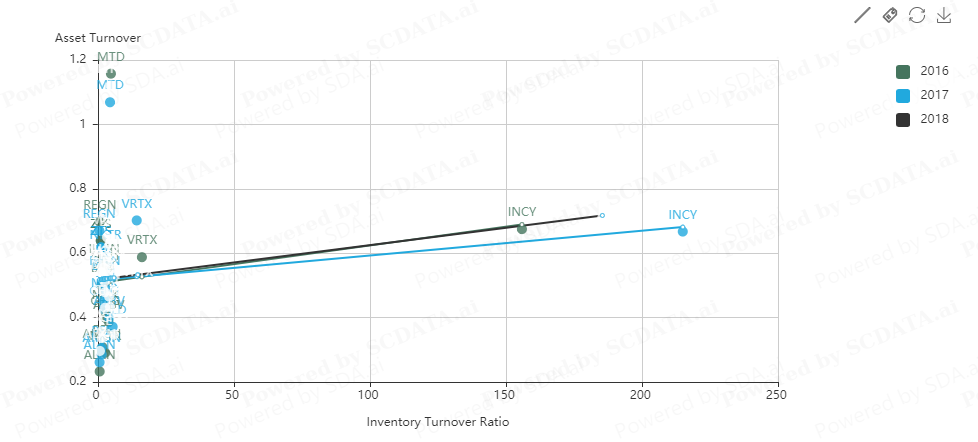
In Food, Beverage, and Tobacco industry, in USA, in all three years, the Asset Turnover
is positively related to Inventory Turnover Ratio, which means that more frequently a
company replenishes its inventory , the better ability it has to manage its asset, because
inventory is also a kind of asset. Among the three years, Year 2018 is the most capability
of managing the asset.
11/22
Value Driver Analysis--USA, Pharmaceuticals, Biotechnology& Life Sciences

12
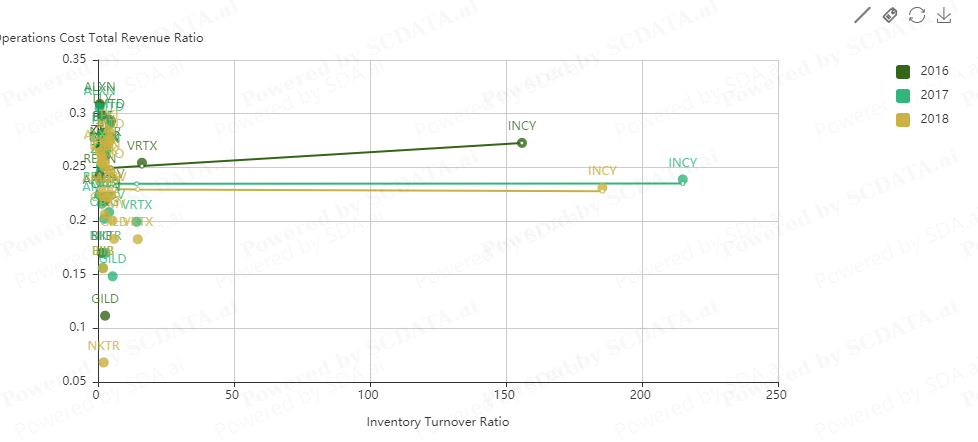
In Pharmaceuticals, Biotechnology& Life Sciences industry, and in all three years, the
operations cost total revenue ratio is positively related to inventory ratio, even though in
2017 and 2018, the trend is not so obvious, which means that the more quickly the
company sell and replenish its inventory, the higher cost to the revenue. Maybe the cost
for ordering new inventory is more costly than keeping the inventory. Also, maybe
because the company buys a few things each time and buy many times from the
suppliers, it loses the negotiation power with the suppliers.
12/22
Value Driver Analysis

13
As we can see, the Gross Margin is negatively related to Inventory Turnover Ratio, which
means that the more quickly the company sells and replenishes its products, the lower the
profitability. Maybe the transportation fee for buying new inventories is too high.
13/22
Value Driver Analysis

14
In Pharmaceuticals, Biotechnology& Life Sciences, in USA, in all three years, the Asset
Turnover is positively related to Inventory Turnover Ratio, which means that more
frequently a company replenishes its inventory , the better ability it has to manage its
asset. Among the three years, Year 2018 is the most capability of managing the asset.
14/22
Benchmark by KPI

15
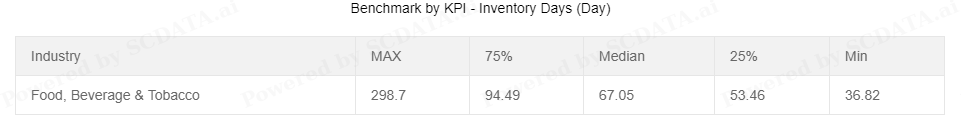
I pick Food, Beverage and Tobacco industry, and the maximum inventory days in the industry are about 298.7 days, while the median inventory days are about 67.05 days. The minimum inventory days are about 36.82 days.
15/22
Enterprise Ranking

16
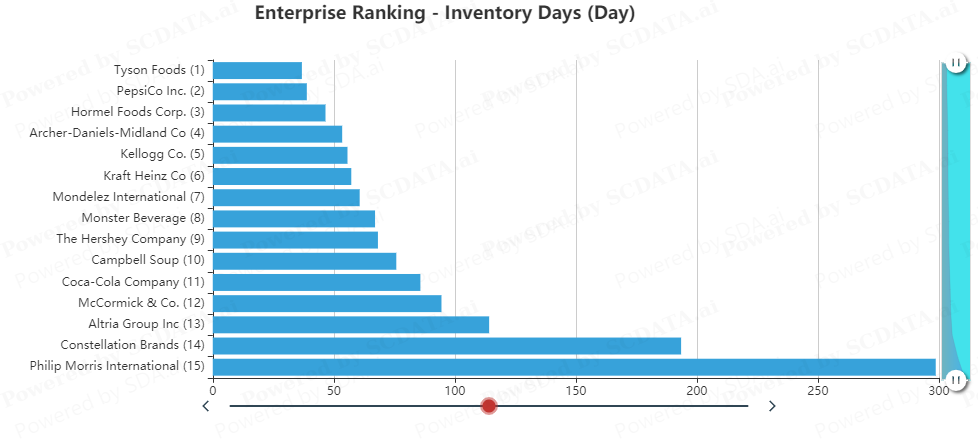
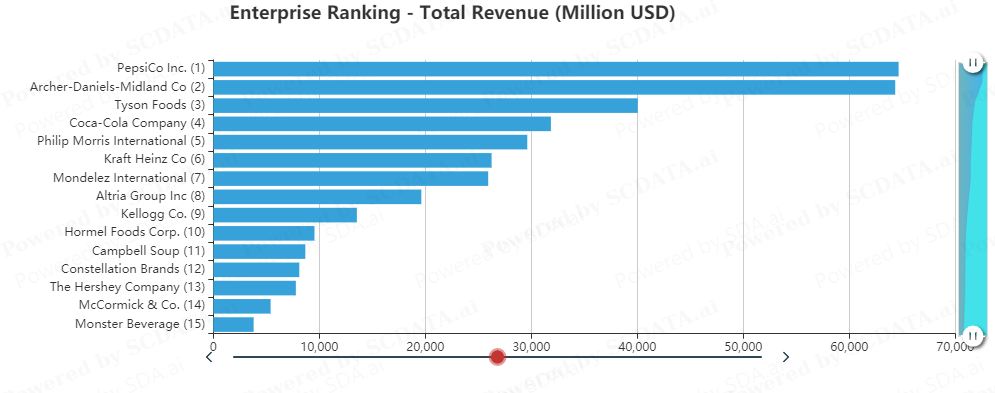
As we can see in the picture above, as for inventory days PepsiCo. Inc ranks the second
in the list, while Coca-Cola Company ranks the 11th, which means that PepsiCo. Inc has
a shorter inventory days than Coca-Cola Company. PepsiCo. Inc has a better inventory
management than Coca-Cola Company.
16/22
Enterprise Ranking

17
As we can see in the above picture, Pepsi has the highest Total Revenue, while CocaCola ranks the forth in the list, and Coca-Cola’s revenue is just about half of that of
Pepsi.
17/22
Enterprise Comparison

18
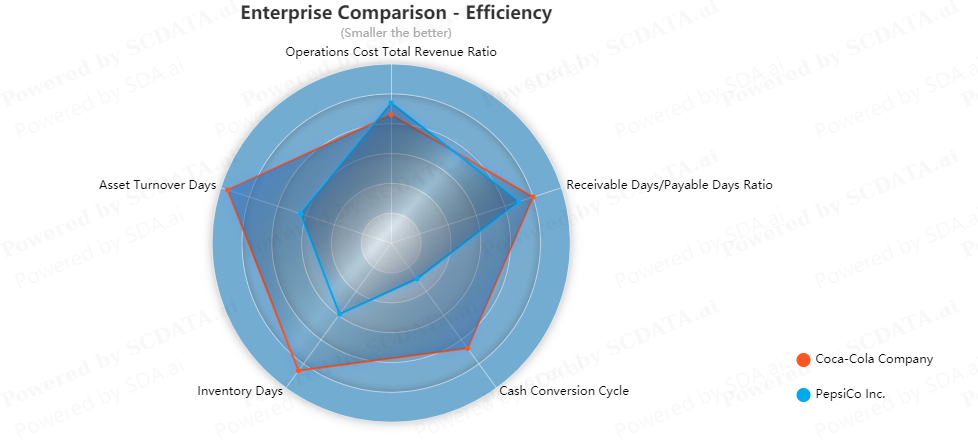
PepsiCo has a little bit higher operations cost total revenue ratio than Coca-Cola, which
means Pepsi has a higher percentage of operation cost and generates lower revenue with
the same amount of cost, and Coca-Cola runs more efficiently than PepsiCo. As for
Receivable Days/ Payable Days Ratio, The ratio for PepsiCo is smaller than that for
Coca-Cola, which means that PepsiCo has stronger negotiation power against its
customers than against the suppliers compared with Coca-Cola. As for Cash Conversion
Cycle, PepsiCo has a much shorter period than Coca-Cola, which means that PepsiCo
could sell its inventories more quickly and convert its inventories to cash more quickly
than Coca-Cola. As for Inventory Days, PepsiCo has a much shorter period, which means
that PepsiCo keeps its inventories in hand for a shorter period, and PepsiCo manages its
inventories better than Coca-Cola. As for Asset Turnover Days, PepsiCo has a shorter
period, which means that PepsiCo generates revenue faster than Coca-Cola and Pepsi
runs more efficiently.
18/22
Enterprise Comparison

19
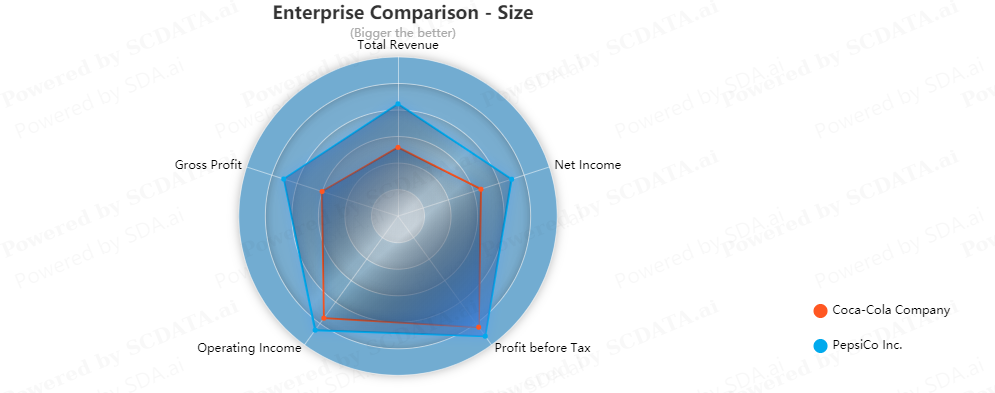
As we can see in the above graph, for Total Revenue, Net Income, Profit Before Tax,
Operating Income, and Gross Profit, Pepsi’s numbers are all higher than Coca-Cola’s. So,
obviously, Pepsi has higher profitability.
19/22
Enterprise Trend

20
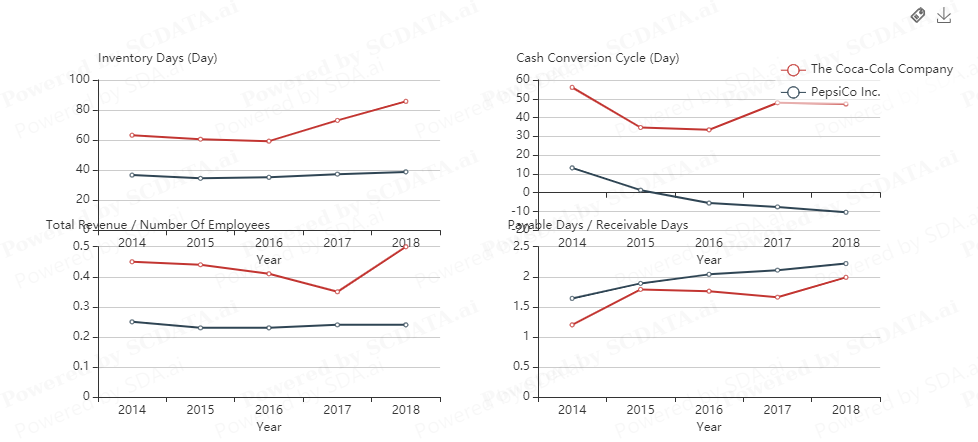
As for Inventory Days, PepsiCo has a much shorter period, which means that PepsiCo
keeps its inventories in hand for a shorter period, and PepsiCo manages its inventories
better than Coca-Cola. As for Cash Conversion Cycle, PepsiCo has a much shorter period
than Coca-Cola, which means that PepsiCo could sell its inventories more quickly and
convert its inventories to cash more quickly than Coca-Cola. As for Receivable Days/
Payable Days Ratio, The ratio for PepsiCo is smaller than that for Coca-Cola, which
means that PepsiCo has stronger negotiation power against its customers than against the
suppliers compared with Coca-Cola. The results of the three ration above is the same as
the pie graph in the last analysis. As for Total Revenue/ Number of Employees, CocaCola has a higher ratio, which means given the same amount of employees, Coca-Cola
can generate more revenue, and this shows that Coca-Cola’s employees are more
productive and have higher working efficiency.
20/22
KPI Examination

21
As we can see in the above graph, Coca-Cola outperforms almost all the companies in its
industry in Gross Margin, the Growth of Net Income, and Operations Cost Total Revenue
Ratio, which means Coca-Cola is more profitable than most of its peers, but Coca-Cola
runs less efficiently than its peers, because it uses more resources to generate the same
amount of revenue. What’s interesting, even though Coca- Cola has a negative growth
rate of the Total Revenue, which is worse than almost its peers, Coca-Cola’s net income
grows faster than most of its peers, which means that Coca-Cola does a really good job
on cost reduction. Other indexes of Coca-Cola are just at normal level.
21/22
KPI Examination

22
For Pepsi, its Return on Assets and Return on Invested Capital is higher than most of its
peers, which means that Pepsi is more profitable than most of its peers, and it can
generate more profits for the given amount of assets or investments. A for the Liabilities
Asset Ratio, Pepsi has higher ratio than normal, which means Pepsi is more risky than its
peers and Pepsi has more reliance on its creditors. As for the net income, Pepsi has a
higher growth rate than its peers, which means Pepsi has greater growth potential.
However, Pepsi has less Free Cash Flow than before, which means that Pepsi’s capital
turnover is not as effective as before. As for the Operations Cost Total Revenue Ratio,
Pepsi’s ratio is almost the highest one in its industry, which means that the operation of
Pepsi is not as effective as its peers, because when generating the same revenue, Pepsi
has higher costs. As for the Inventory Days, Pepsi has a shorter period than most of its
peers, which means that Pepsi keeps its inventories for a shorter period, and Pepsi
manages its inventory better than most of its peers. Finally, the Cash Conversion Cycle
for Pepsi is more quickly, which means that Pepsi can convert the inventory into more
quickly than its peers. Maybe this is because Pepsi’s product is more popular, or maybe it
has fewer inventory on hand.
22/22