Sourcing Analytics
Identify and Select Suppliers of Semiconductors for Ford Cars
Kabir Paul
Supply Chain Analytics Student
HW - 9

Ford and Semiconductors
Ford is an American multinational automobile manufacturing company that sells millions of cars worldwide.
During 2020's Covid-19 pandemic, most automobile manufacturers faced a shortage in semiconductor chips for cars, including Ford.
Semiconductors are a crucial component for all modern cars as it allows connectivity and access to apps like car-play.

Assessing Company Needs
Defining Supplier Selection Criteria

Observations and Conclusions
In terms of an Enterprise Ranking between the Automobile manufacturers of the US, Korea, China, and Japan, Ford ranks 2nd in size.
Note - Toyota Motor, a Japanese firm, is significantly bigger than Ford, almost double in fact.
In terms of Industry trend, Japan far outranks any other country. The US appears to be right under Japan, close to China, in terms of Revenue, Operating Income and Net Income. Korea ranks lowest in all metrics
Note - US saw a sharp decline in the proportion of profitable enterprises recently, bringing it lower than Kore
In terms of Operating Margin vs Revenue in the US, Ford has the highest amount of revenue but is average in the case of operating margin, .072. Companies such as General Motors and Tesla have higher operating margins in comparison, .074 and .121 respectively.
In terms of Operating Income vs Total Cost, Ford ranks first in both. It not only has the highest Operating income but also highest costs. General Motors has a similar cost and operating profit, whereas Tesla on the other hand has relatively lower costs for the operating profit that it is making signaling it has a very well run operating structure.
In terms of Revenue Breakdown, The industry average for COGS in the US is 83%. Ford, being an industry leader and being at 84% is definitely troublesome. General Motors is doing even worse at 85% but Tesla is the best out of these with 74%.
Overall, Ford is a well run company that is the largest in the US in terms of Total Revenue and Operating income. It is not the most efficient in terms of Costs as it has above-average COGS and a higher cost/income ratio. Hence, COGS is definitely the cost driver for Ford, which makes sourcing all the more important.

Semiconductor Selection Criteria
Pricing
Engineering Capabilities
Manufacturing Capacity
Responsiveness
Experience
Bargaining Power
Financial Health

Market Intelligence
Analyzing Supplier Markets to Identify the Right Suppliers


Market Intelligence
Competition Intensity


Observations and Conclusions
In terms of global Total Revenue within the Semiconductor industry, it appears that the US has the highest amount of revenue by a significant margin(3xChina). It is then followed by China, Taiwan, Korea, Japan, Germany and Switzerland.
In terms of global Revenue Growth Rate, it appears that Ireland is growing at the fastest rate in the world, which is over double the next country. The countries to follow Ireland are Canada, Norway, China, Cayman Island, Netherlands and Korea.
In terms of Industry trend by size among the US, China, Ireland, Korea and Taiwan, it can be seen that United States consistently outperforms all other countries. China and Taiwan have very similar revenue but Taiwan outperforms China in terms of Operating and Net income. It also appears that most countries took a hit in 2018, with Korea at worst, but are all on an upwards trajectory, signaling a healthy market. Ireland being very new into the market is lowest in all metrics.
In terms of Competition Intensity within the US, it appears that the market is relatively stable with very few fluctuations. There are still a few big companies the control a majority of the market such as Intel, Qualcomm, Micron, Texas instruments and Broadcom, but the industry is quite competitive.
A Four Firm Concentration ratio analysis yields a similar result showing that the market has become more competitive over the years going from the top 4 firms owning >80% of the market to owning <60% of the semiconductor market.
Comparing Net Income competition, it appears that Intel, Nvidia, Texas Instruments have seen relatively stable net income whereas Broadcom and Qualcomm have seen great variance in it. Micron Technology and Broadcom both has significant net income in 2018 which decreased over time. Qualcomm on the other hand, had negative income in 2018 but has slowly seen its income rise.
Overall, the top countries for sourcing semiconductors for Ford are the US, China and Korea. The US is included as it is a significant part of the global semiconductor market along with being a home market for Ford. China and Korea are not only some of the biggest semiconductor markets in the world but also some of the fastest growing, which signals a strong market.
The semiconductor market within the US is quite competitive and is getting more competitive every year. The top 4 companies now own less than 60% of the market which signals healthy competition, bargaining power and plenty of options for Ford.

Potential Suppliers and Why?
Intel - Largest Supplier
Broadcom - New supplier in top 5 (experience diversity)
Qualcomm - Second largest supplier in the US
SK Hynix - Second largest supplier overall and is Korean (for geographic diversity)
NVIDIA Corp - Top 6 supplier and is growing revenue and net income consistently

Supplier Analysis
Pricing, Profit and Technology

Observations and Conclusions
In terms of Supplier Comparison by size, it appears that Intel is by far the largest in every metric. It is then followed by SK Hynix, which does have the second largest operating income, revenue and profit before tax but not net income. This suggests that it might be incurring a lot of other costs causing it's net income to drop. Nvidia, Qualcomm and SK Hynix are very close competitors in terms of all metrics. Lastly, it appears that Broadcom is the smallest enterprise for all metrics.
In terms of Supplier Comparison by profitability, it appears that while Intel is the largest, it is not the most profitable. All of the companies has positive margins and SK Hynix has the lowest gross margin. Nvidia has the highest Operating, Gross and Net margin with almost the highest ROA. Qualcomm is doing very well in terms of gross margin and net margin along with ROA. Broadcom has a relatively high gross margin as well. All of these companies have high gross margins, except SK Hynix.
In terms of Supplier Revenue Breakdown, SK Hynix has the highest COGS, with above average spend on R&D and Net income. It is then followed by Intel with the second highest COGS, and Qualcomm with the third highest. NVIDIA does come in last with the lowest COGS, right after Broadcom.
In terms of Supplier Profitability Trend, SK Hynix has dropped in all metrics recently and is making its way back up. Intel's margins are quite stable and decreasing over time. Broadcom sees high and increasing gross margins, whereas its Net and operating margin have seen a decline. Qualcomm has very unstable margins with gross margins being high and net margin being quite low. Lastly, Nvidia appears to be the best performing here with highest and increasing margins.
Note - Broadcom and SK Hynix are relatively new in the industry while other companies have more experience
Overall, due to similar cost of goods, COGS as a % of revenue has an inverse relationship with pricing. SK Hynix has highest COGS% and hence signals that it has the lowest pricing. It is followed by Intel and then Qualcomm with higher pricing. Broadcom then has the second highest pricing followed by NVIDIA with the lowest COGS% and highest pricing.
Pricing (Low to high): SK Hynix-> Intel-> Qualcomm->Broadcom-> NVIDIA
High Gross Margins along with R&D spend signal good innovative/engineering capability. While all suppliers have high gross margins(>50%), SK Hynix falls behind at 44% making it the least capable. Out of the 4 left suppliers, Qualcomm has the highest spend on R&D, followed by NVIDIA, Intel and then Broadcom. This doesn't necessarily signify exact ranking due to size and experience differences.
Engineering Capability (Low to High): SK Hynix-> Broadcom-> Intel-> NVIDIA-> Qualcomm

Supplier Analysis II
Financial Stability and Risk

Observations and Conclusions
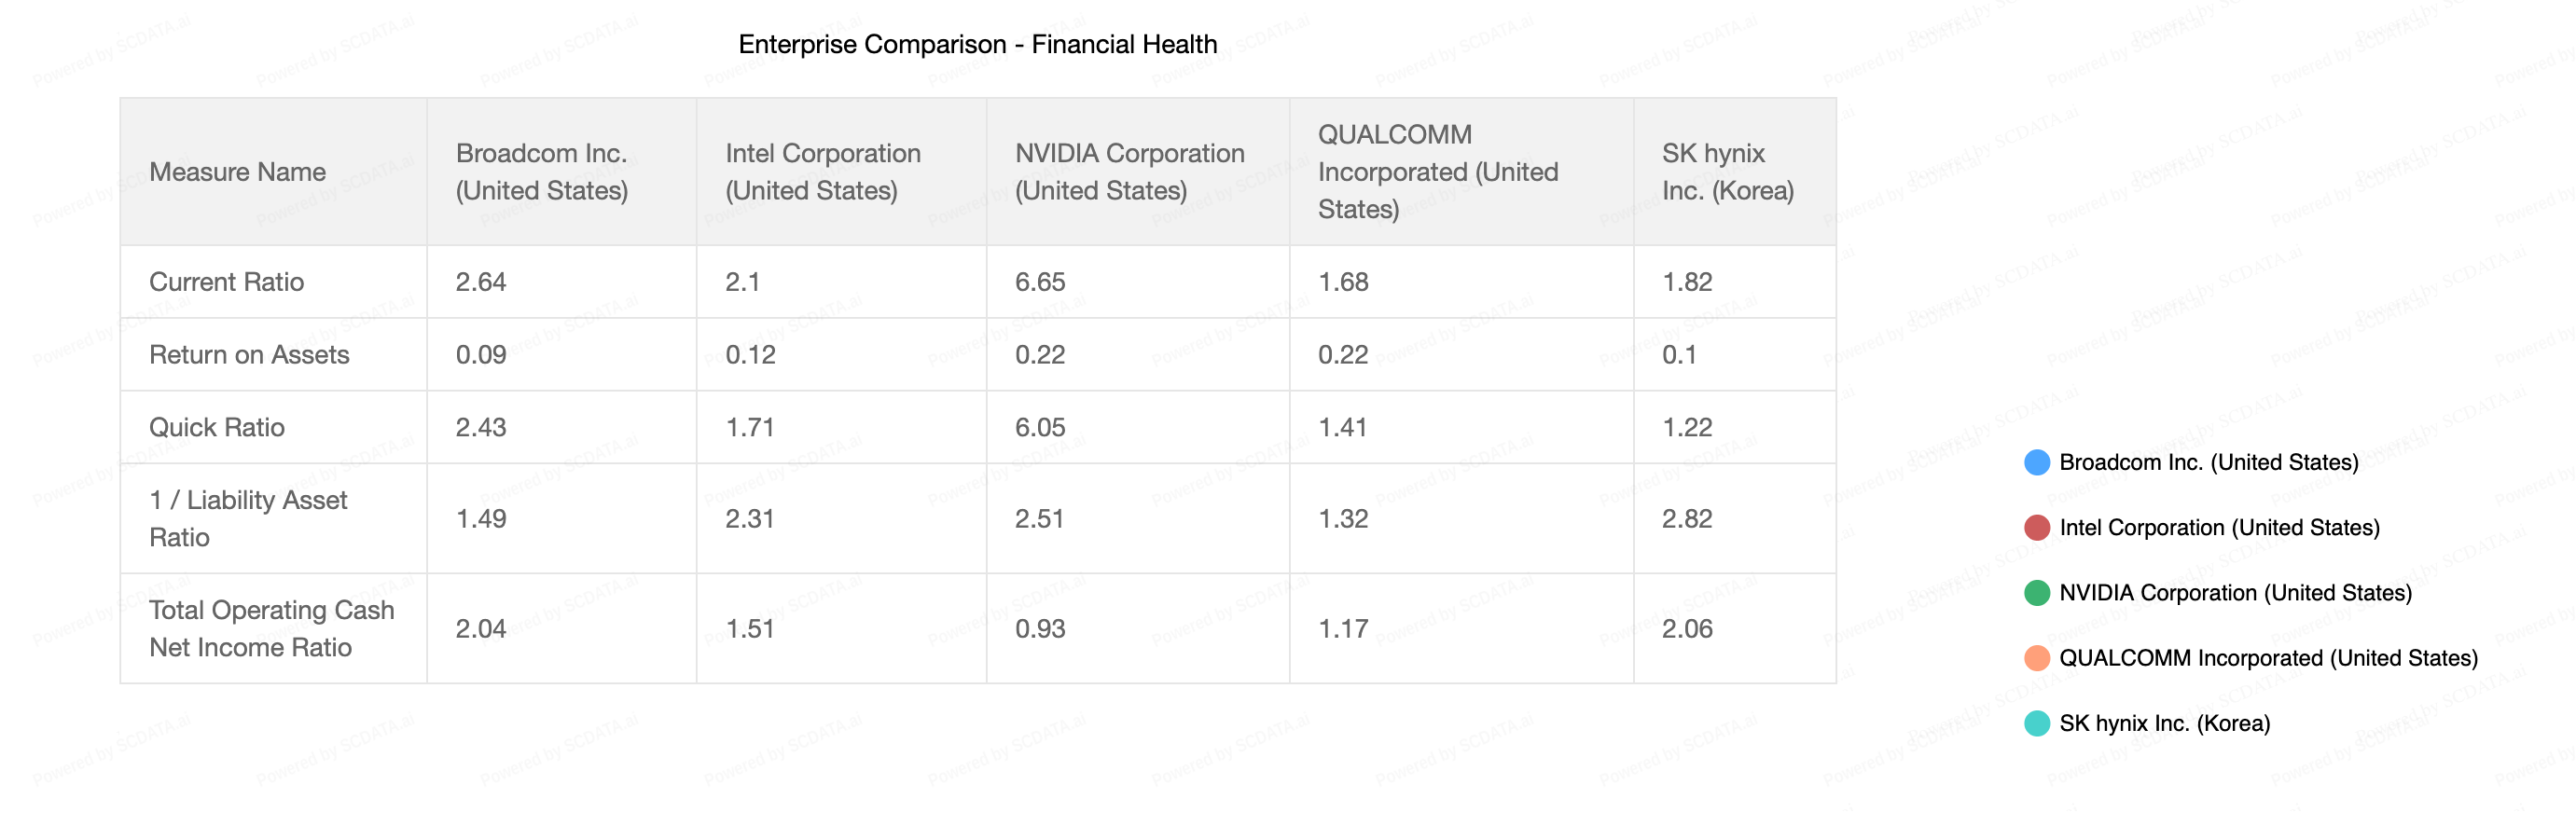
In terms of a Supplier Comparison by Financial Health, it appears that all companies are financially healthy in the short-term, seen by current ratio>1. NVIDIA has highest current ratio of 6.6, meaning it has way more assets than liabilities, whereas Qualcomm, 1.68, has the lowest. Quick Ratio follows a similar trend with NVIDIA leading, followed by Broadcom and Intel. Qualcomm and SK Hynix have switched ranks with Qualcomm coming in higher, signaling SK Hynix holds a large amount of inventory. Comparing the 1/liability asset ratio, it can be noted that all companies are healthy in the long term as they all place above 1 as well. Lastly, when comparing total operating cash to net income ratio, we see that all companies make good cash flow from operations signaled by >1 ratio except NVIDIA (very close to 1), with SK Hynix in the lead.
In terms of a Liability-Asset Breakdown, SK Hynix has the lowest amount of liabilities and highest equity. This is very closely followed by NVIDIA with significant equity but larger non-current liabilities. Qualcomm has significantly more liabilities than any of the other suppliers and the lowest equity as well, signaling risk. Broadcom follows Qualcomm with the second highest liabilities out of the 5. Lastly, Intel is holding well with a significant portion of equity while having slightly above average current liabilities.
In terms of a Detailed Asset Breakdown, SK Hynix has the highest amount of property plant and equipment but it is low on cash. Broadcom appears to a majority of their assets into goodwill, with very little PPE. NVIDIA appears to be heavily invested in short term investments and has a below average amount of PPE and Cash. Qualcomm does posses the third highest amount of PPE with the highest amount of cash. Lastly, Intel appears to be doing quite well in terms of PPE, being above industry average, but is lowest in cash.
In terms of Supplier Financial Health Trend, It appears all companies have been financially healthy in the recent years for the short term, seen by current ratio>1. SK Hynix stands out by having a significant high current ratio over the years. In terms of Liability Asset Ratio, it appears all companies are financially healthy in the long run with the exception of Qualcomm and Broadcom. Long Term Debt Ratio follows a similar trend with all companies doing well except Qualcomm and Broadcom.
Overall, the current ratio and 1/liabilities asset ratio along with equity of a company is a good indicator of a firms short and long-term financial health. NVIDIA has the highest current ratio and the second highest 1/liabilities asset ratio, signaling that it is the healthiest. SK Hynix comes in second, with fourth highest current ratio and highest 1/liabilities asset ratio, signaling it be stronger in the long-term. Intel and Broadcom seem to be opposites, with Broadcom having higher current ratio, hence healthier in the short-term, and Intel having a higher 1/liabilities asset ratio, signaling healthier in long-term but due to Intel's size and experience, it ranks above Broadcom. Lastly, Qualcomm is riskiest with lowest Current ratio and 1/liabilities asset ratio.
Financial Health(low to high): Qualcomm->Broadcom->Intel->SK Hynix->NVIDIA.
The Property Plant and Equipment and Cash on hand are both great indicators of a firm manufacturing capability and responsiveness. Based on such, SK Hynix has the largest amount of PPE and above average cash on hand, signaling that it has the highest manufacturing capability and responsiveness. Intel comes in next with significantly above average PPE but it is the lowest on cash, signaling that it does have high manufacturing capability but medium responsiveness. Qualcomm has the third highest PPE investment with the highest amount of cash, signaling it has a medium manufacturing capability but high responsiveness. NVIDIA has the second lowest PPE investment and cash on hand, signaling that it has medium-low manufacturing capability and medium responsiveness. Lastly, while Broadcom has a significant amount of cash, it has significantly low investment in PPE, signaling very low manufacturing capability and a medium level of responsiveness.
Manufacturing Capability & Responsiveness(low to high): Broadcom->NVIDIA->Qualcomm->Intel-> SK Hynix.

Supplier Analysis III
Operating Efficiency

Observations and Conclusions
In terms of Supplier Efficiency Comparison, Broadcom has the highest Asset turnover days, followed by SK Hynix, Intel, NVIDIA and lastly Qualcomm. In terms of Inventory days, Broadcom is also doing the best, followed by Qualcomm, NVIDIA, Intel and lastly SK Hynix. In terms of Cash Cycle, Qualcomm ranks highest and is closely followed by Intel. In terms of receivable/payable days we see that Qualcomm and Intel are both tied at the top rank, followed by Broadcom and NVIDIA. Lastly, in terms of SGA cost efficiency SK Hynix is doing best, followed by Broadcom, Qualcomm and then both Intel and NVIDIA.
In terms of Supplier Efficiency Trend, inventory days is quite volatile for all suppliers, especially, Qualcomm and SK Hynix. In terms of Cash cycle, all suppliers have been on the decline, with Qualcomm and Intel having the best growth. Payable/receivable days have been high but fluctuating from Intel and Qualcomm. NVIDIA and Broadcom on the other hand are low, with SK Hynix having no data.
Overall, Payable/Receivable days are a good indicator of a company's market position and the bargaining power against it. While Intel and Qualcomm are now tied, Intel is a bigger company and has been higher in the past, therefore would be the hardest for Ford to bargain with. Following Qualcomm, NVIDIA would have some more room to bargain. Lastly, due to Broadcom being the lowest and a new company, it would have the most room to bargain and would be best for Ford. SK Hynix has no information for Payable/Receivable days, hence by default places lowest.
Bargaining Power for Ford Motors(high to low): SK Hynix-> Broadcom-> NVIDIA-> Qualcomm-> Intel.
The experience a company has can be determined from a year over year analysis. This analysis shows the Intel, Qualcomm and NVIDIA have been in the industry for years and this have a significant amount of experience. Broadcom appears to have started in 2016 but had a gap year between 2017-2018, which could be troublesome. SK Hynix was the most recent addition to the industry in 2017 and thus has the lowest experience.
Supplier Experience(low to high): SK Hynix-> Broadcom-> NVIDIA = Qualcomm = Intel

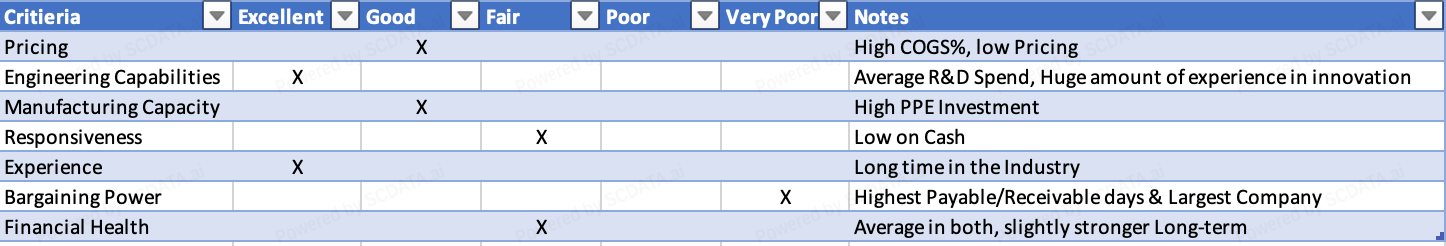
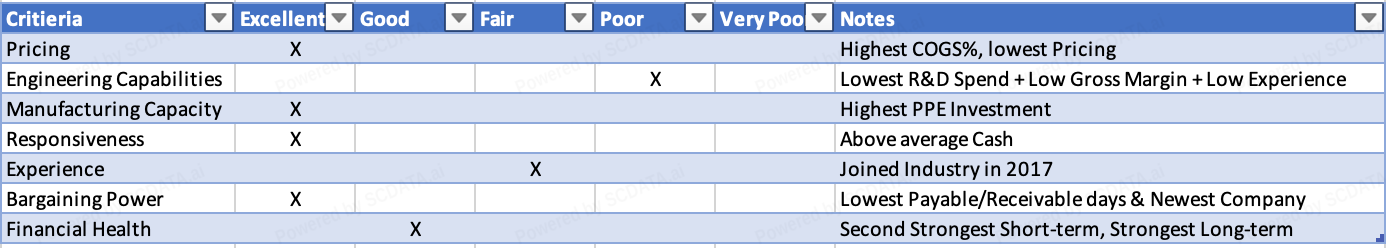
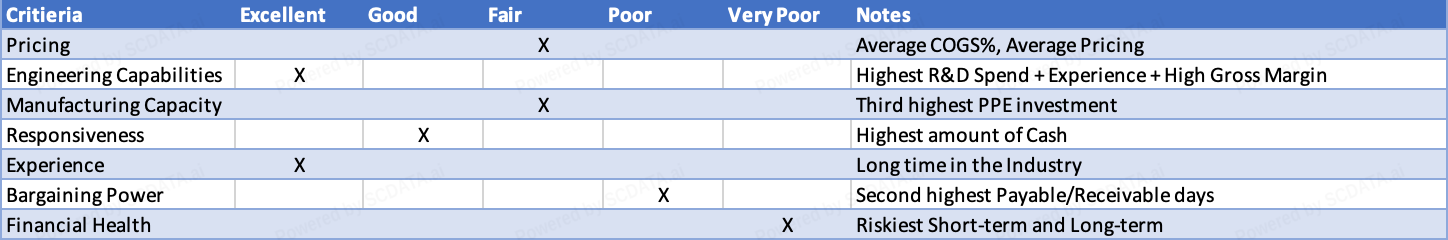
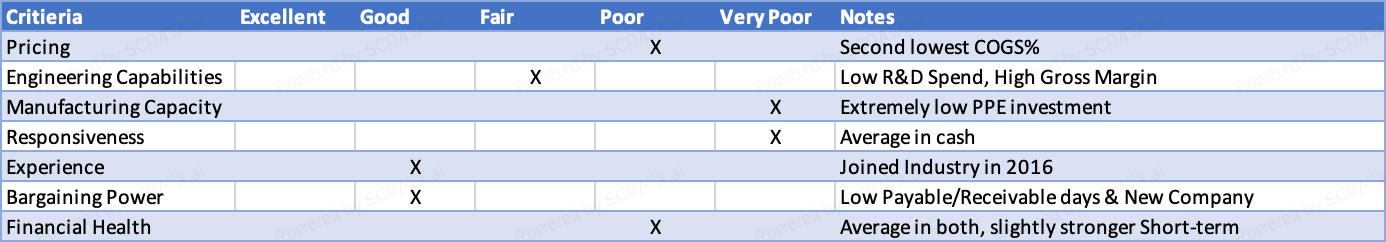
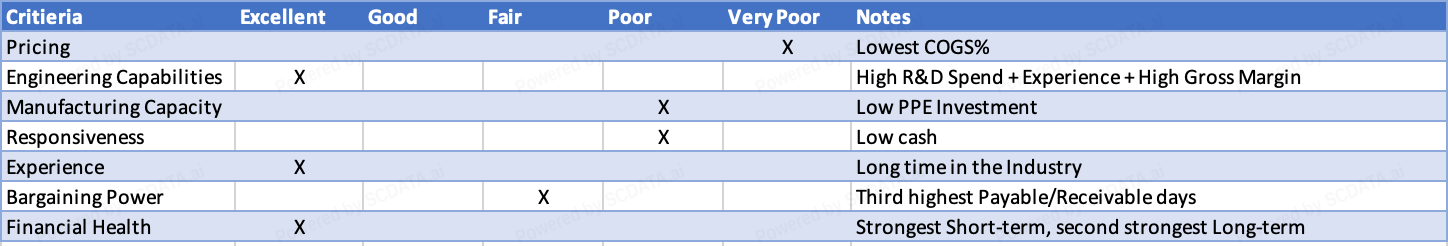
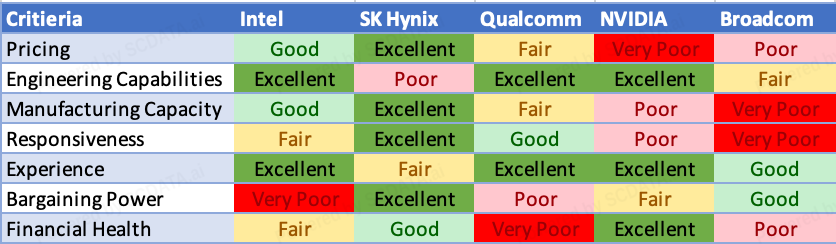
Supplier Scorecards

Semiconductor Sourcing Strategy for Ford Motors
Use SK Hynix Inc. as the primary supplier.
Use Intel Corp. as the secondary supplier.
Cultivate NVIDIA Corp. and Qualcomm Incorporated as potential suppliers.
Broadcom Inc should not be used as a supplier.


