Enterprise Trend on inventory days: Amazon vs Macy's

10
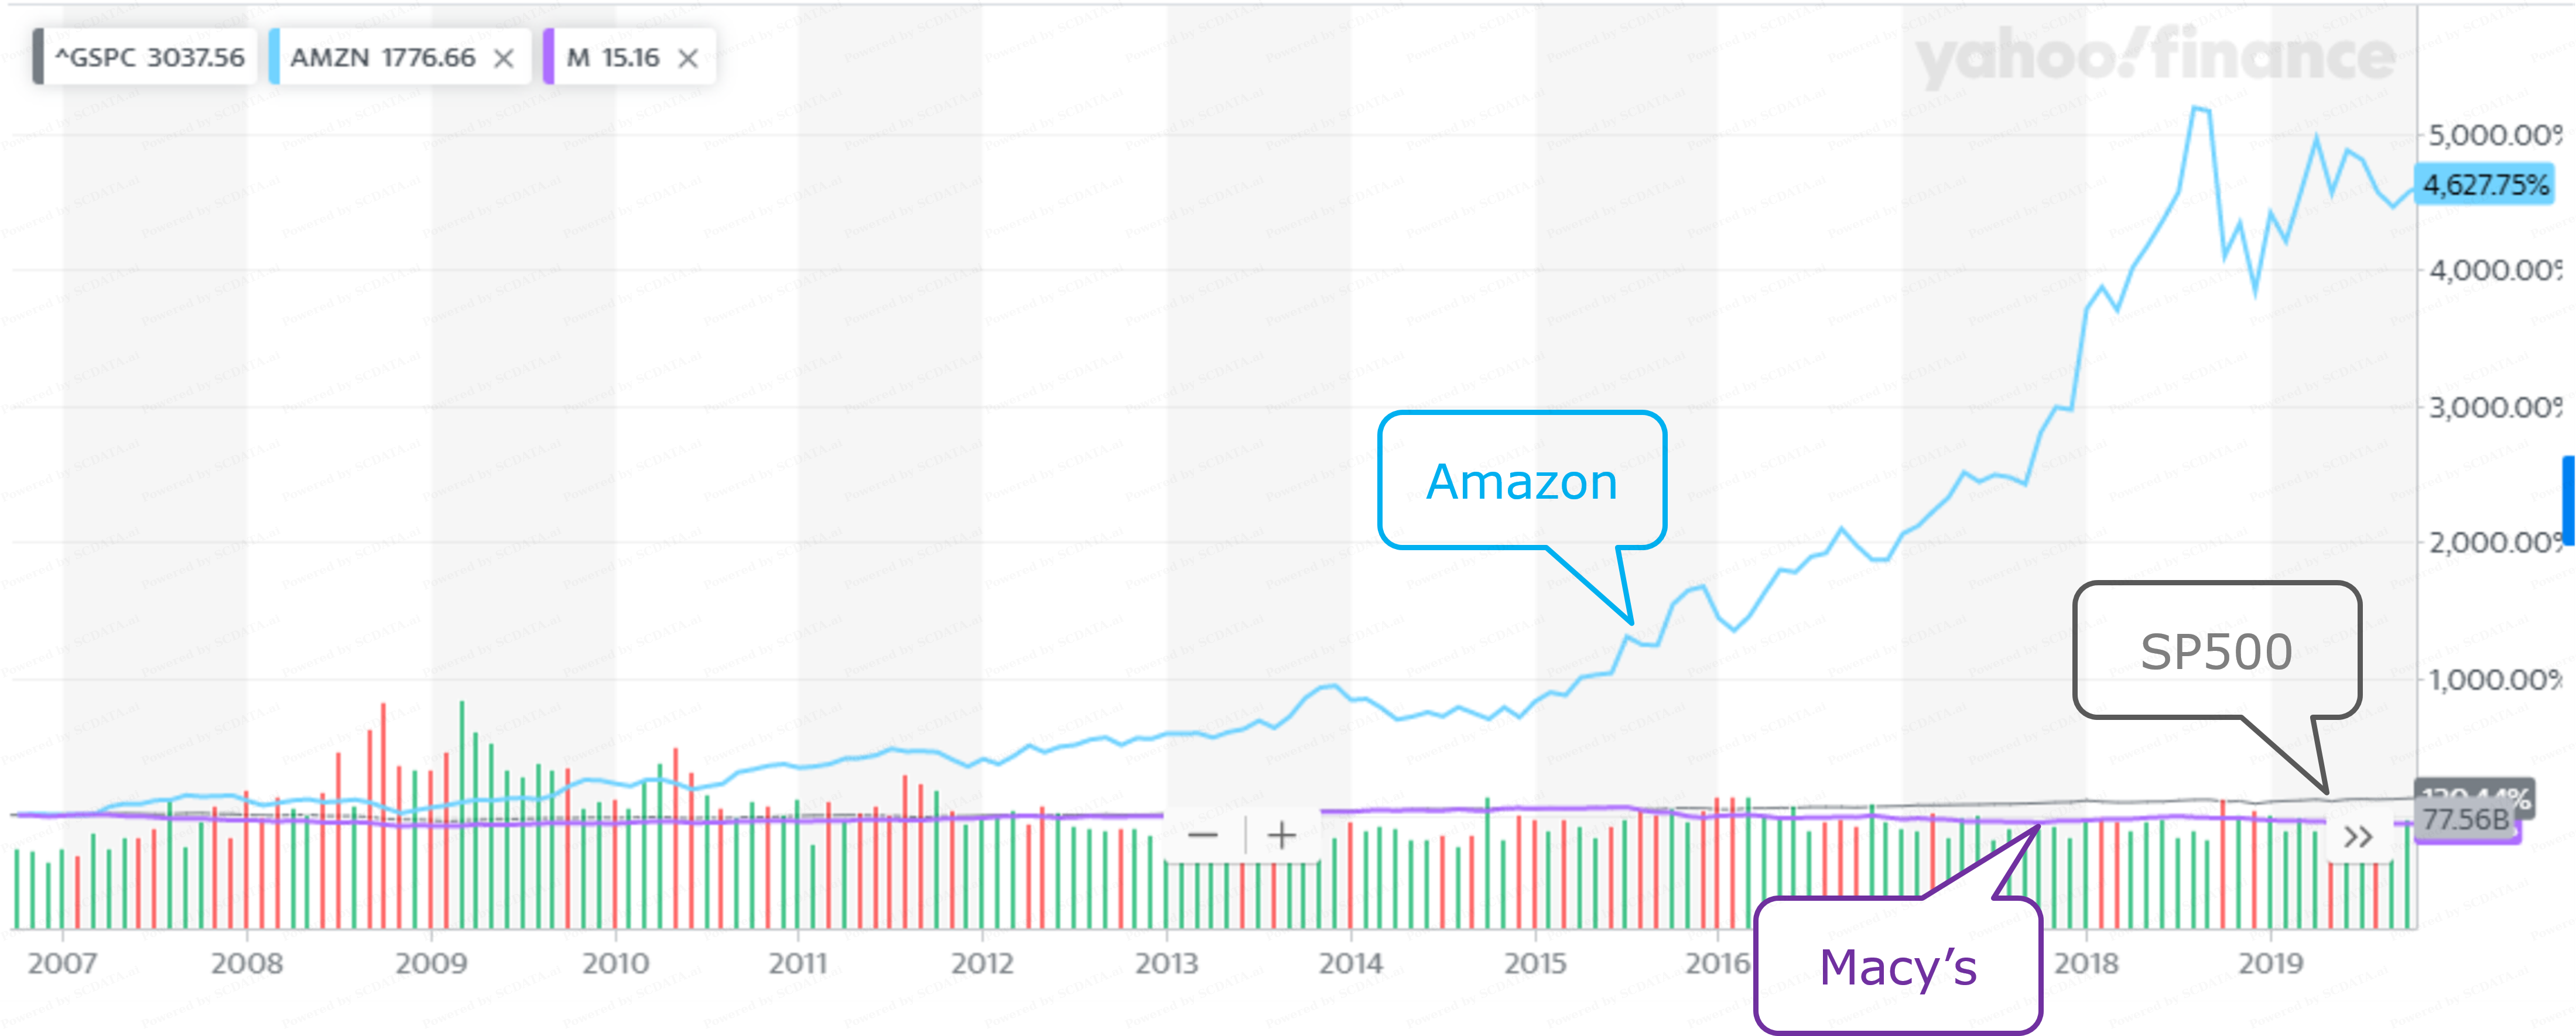
Amazon is also more efficient (shorter inventory days) than Macy’s.
10/58
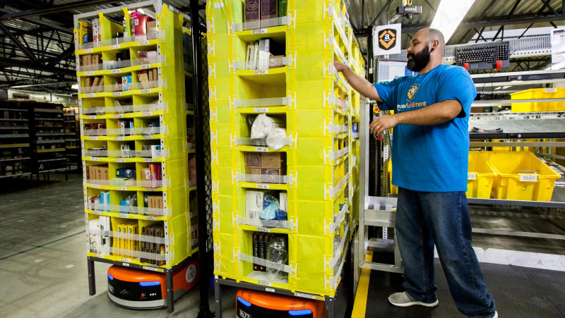
Inventory value

13
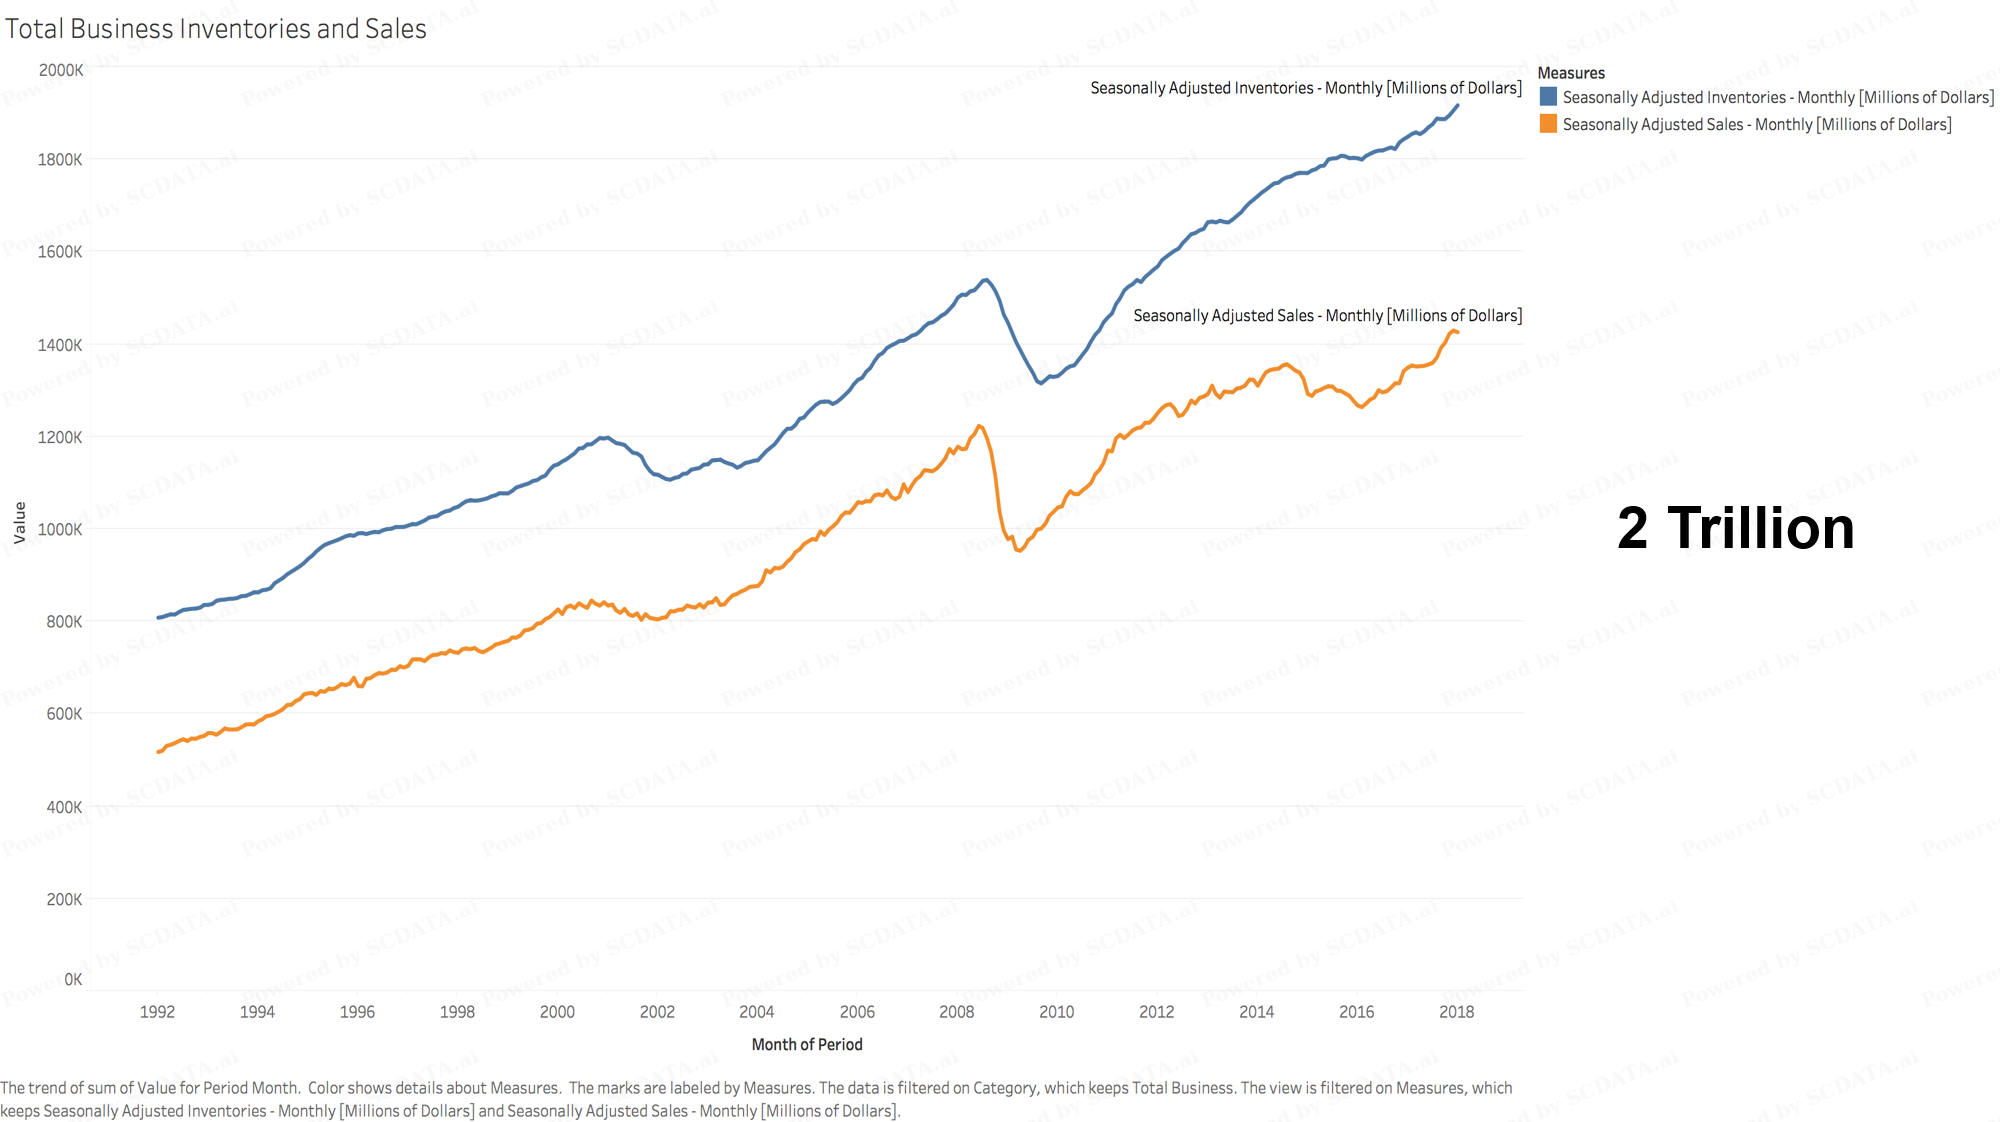
US census data. We plot monthly sales (orange line) and inventory (blue line) from 1992 to 2018 for the US. As we can see, except for the drop around year 2009 due to the financial crisis, both sales and inventory are growing. Up to 2018, we carry about 2 Trillion dollars of inventory.
13/58
Inventory trend

14
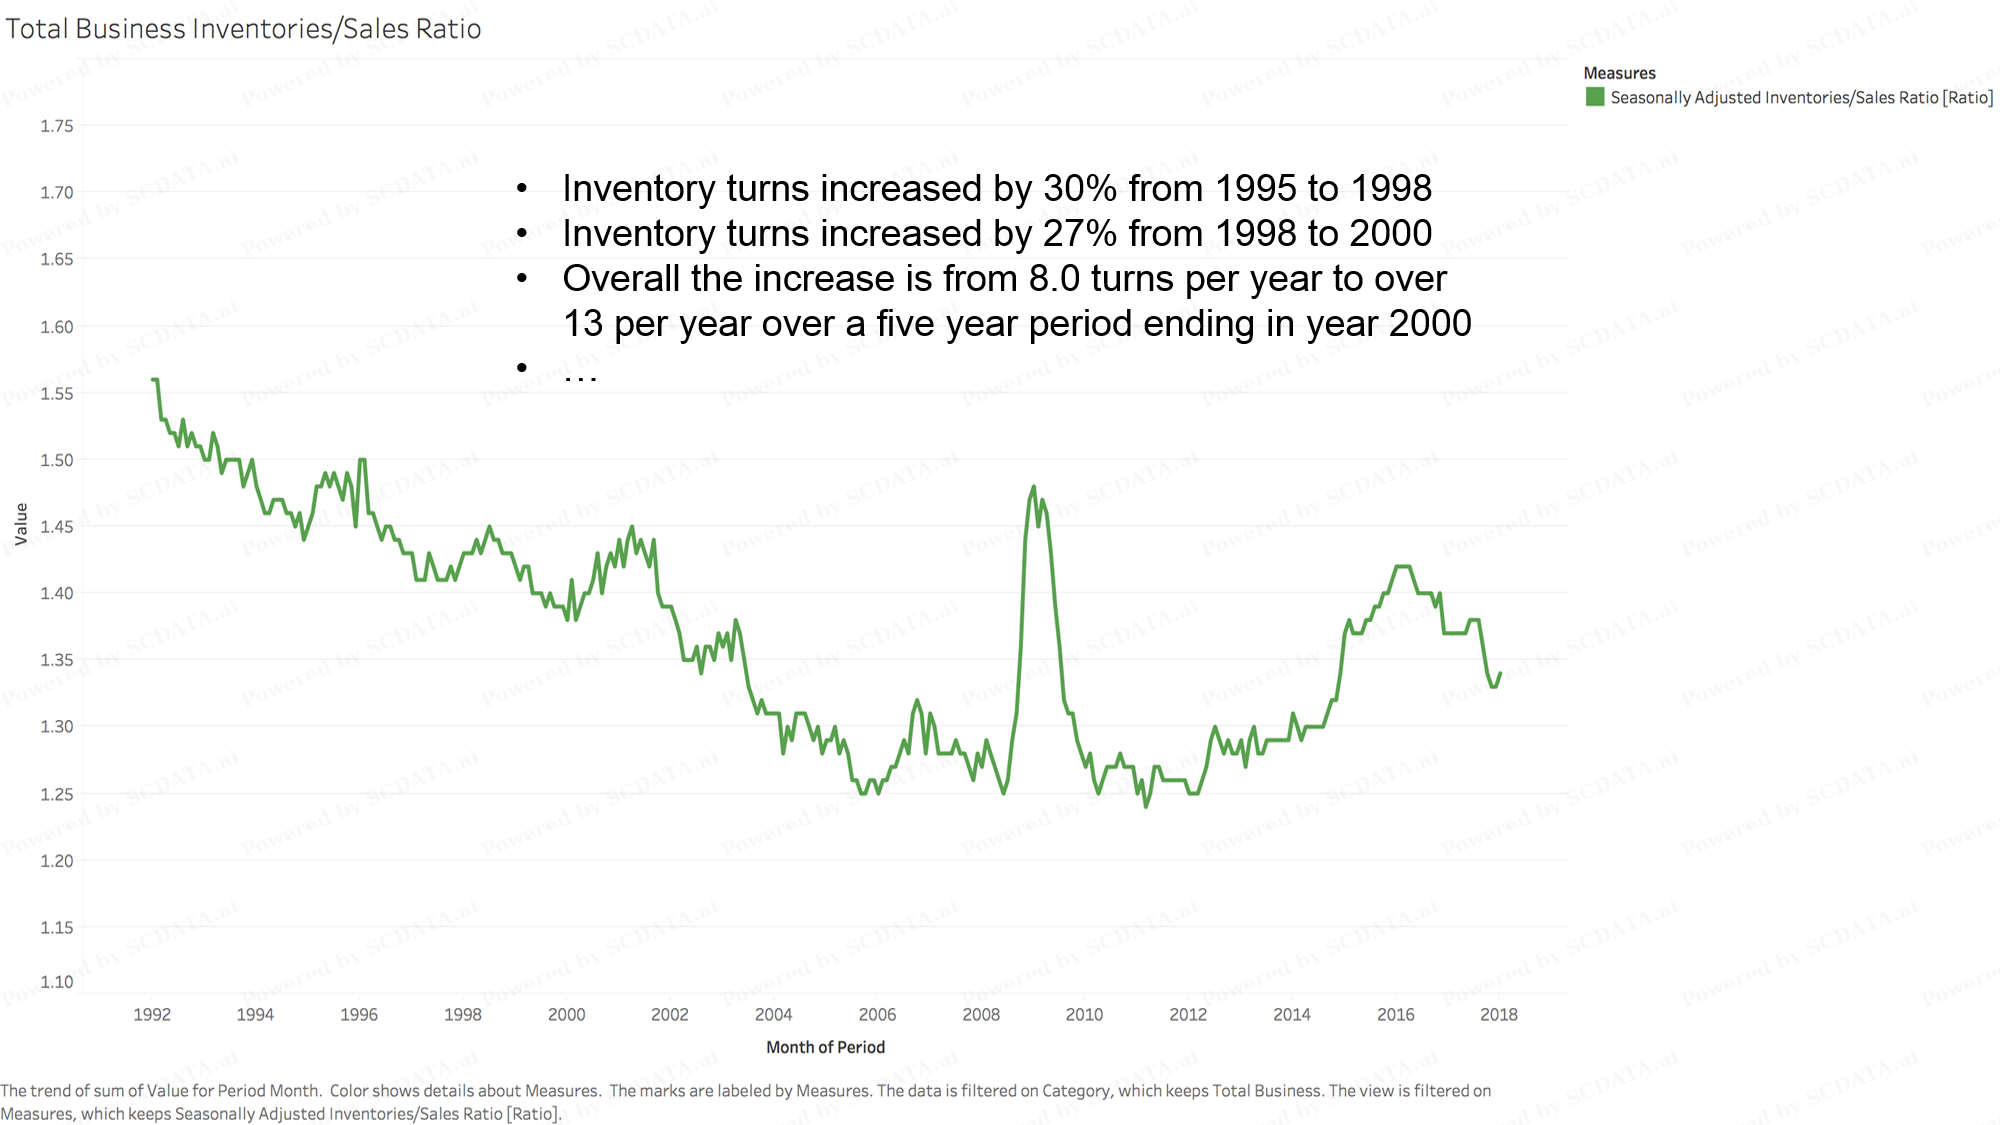
We plot the inventory over sales ratio, which is an indicator of inventory efficiency. The lower the ratio, we need less inventory to meet the same demand, which means a higher inventory efficiency. For the same time period, we found that the inventory efficiency was improving constantly up to 2008, but was disrupted by the financial crisis. Afterwards, inventory efficiency was dropping.
14/58
Where is inventory in the US? 2019

16
In the US, firms headquartered in IL carry the most inventory, which followed by Texas and California. Companies in these states can be more concerned about inventory.
16/58
Where is inventory in China?

17
In China, firms headquartered in Guangdong carry the most inventory, which is followed by Beijing and other coastal provinces.
17/58
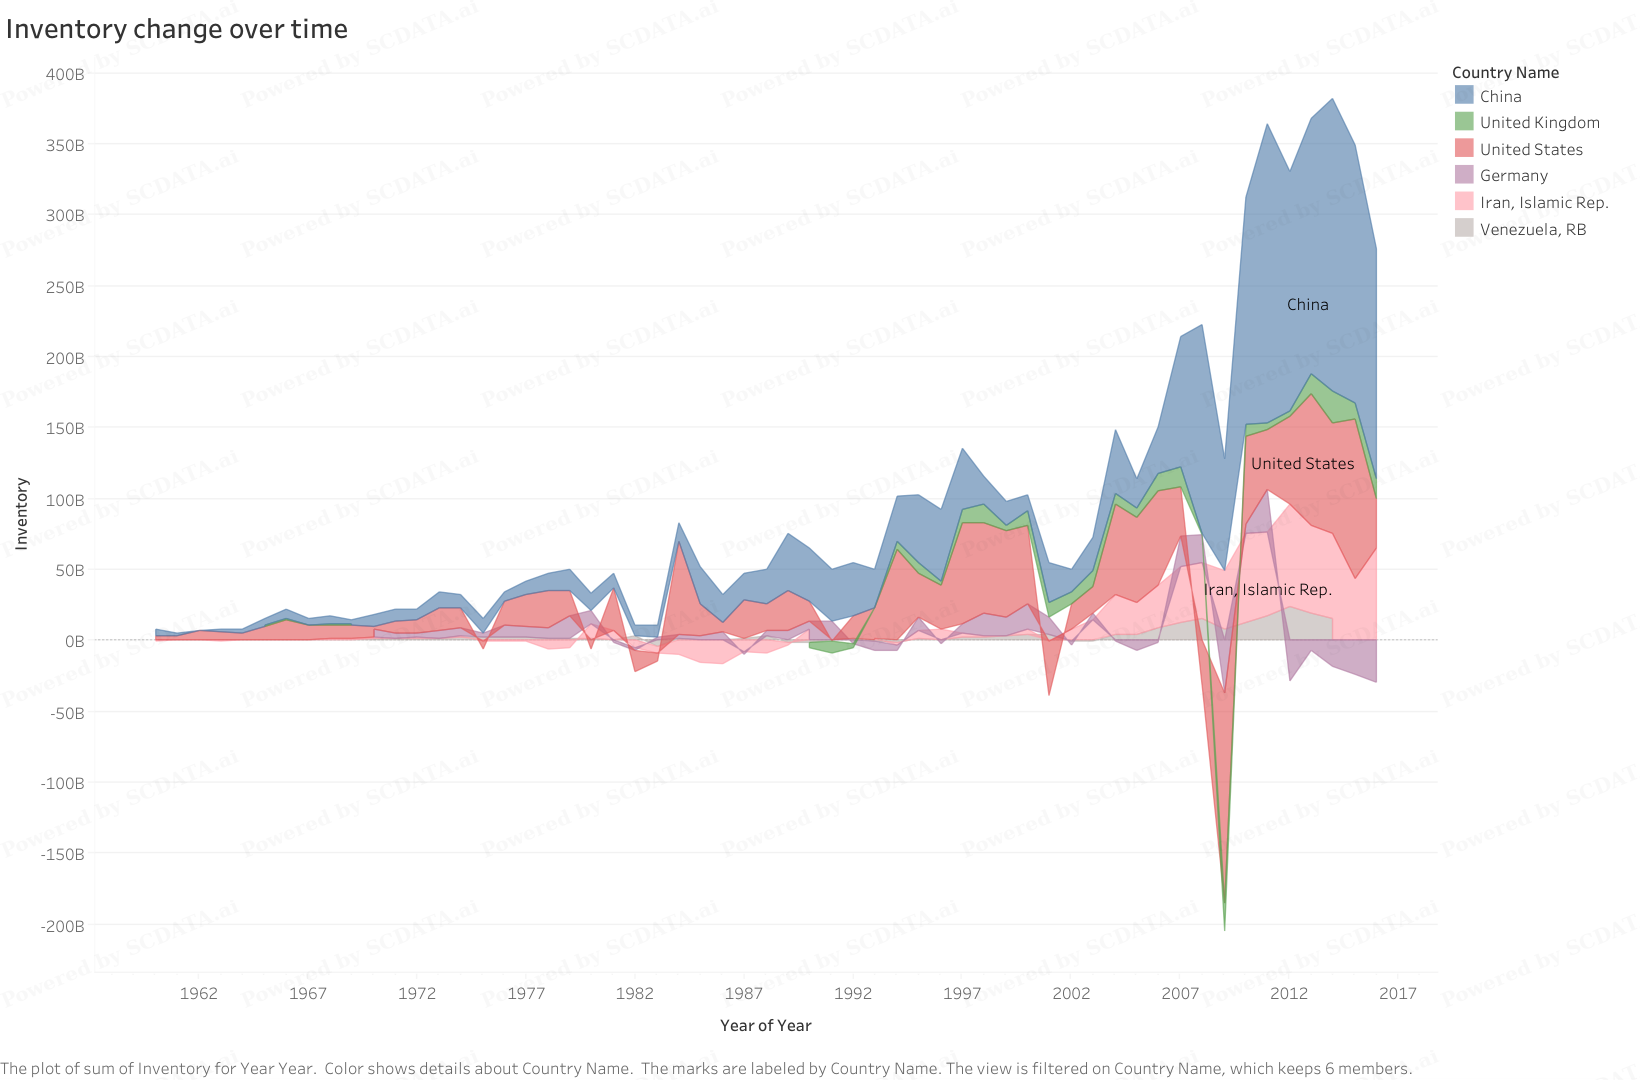
Inventory economic indications

18
The World Bank data on inventory changes provides many interesting indications on the world’s major economies.
1. China’s inventory changes follow the pattern of the US but are slightly lagged behind and much more dramatic than the US in recent years, part of the reason is that China was supplying US.
2.The times of major economic recessions coincide well with the negative changes of inventory. In fact, a significant and negative change of inventory is a strong indicator of economic recession.
3.The changes are swinging bigger and bigger as time goes by, with an almost exponential growth.
4.Germany has a different pattern from the US – a significant and consistent reduction of inventory in recent years, indicating a very different industrial practice on inventory management.
18/58
Enterprise Distribution - inventory

19
Selecting world and inventory on enterprise distribution, we can see China, US and Japan were carrying the most inventory in 2019.
19/58
Enterprise Distribution - inventory

20
Bar chart shows clearly that China's inventory is more than twice as much as that of the US, Japan is the third, and then Germany, France, South Korea and UK. The inventory carried by China is more than the top seven countries (excluding China itself) combined.
20/58
Benchmark by KPI - US, 2019

22
Let’s first look at the US. The table shows inventory over total asset for different level 1 industry sectors in year 2019. We can see that companies in the industry sectors of materials, industrials, consumer discretionary, consumer staples, healthcare and IT have a sizable asset in inventory. In particular, the median firm in consumer discretionary (such as autos, apparel, home appliances, and retail) has 17% of asset in inventory, and the 90th percentile has 47% of its asset in inventory. Although the median of IT firms is 11%, the 90th percentile can go up to 33%. So for these industries, inventory simply cannot be ignored!
22/58
Benchmark by KPI - China, 2019

23
For China, the table looks a bit different: In addition to the industry sectors of materials, industrials and so on, it looks like real estate in China has the highest percentage of asset in inventory with a median of 36%!
23/58
Benchmark by KPI - Inventory / Total Asset, level 2

24
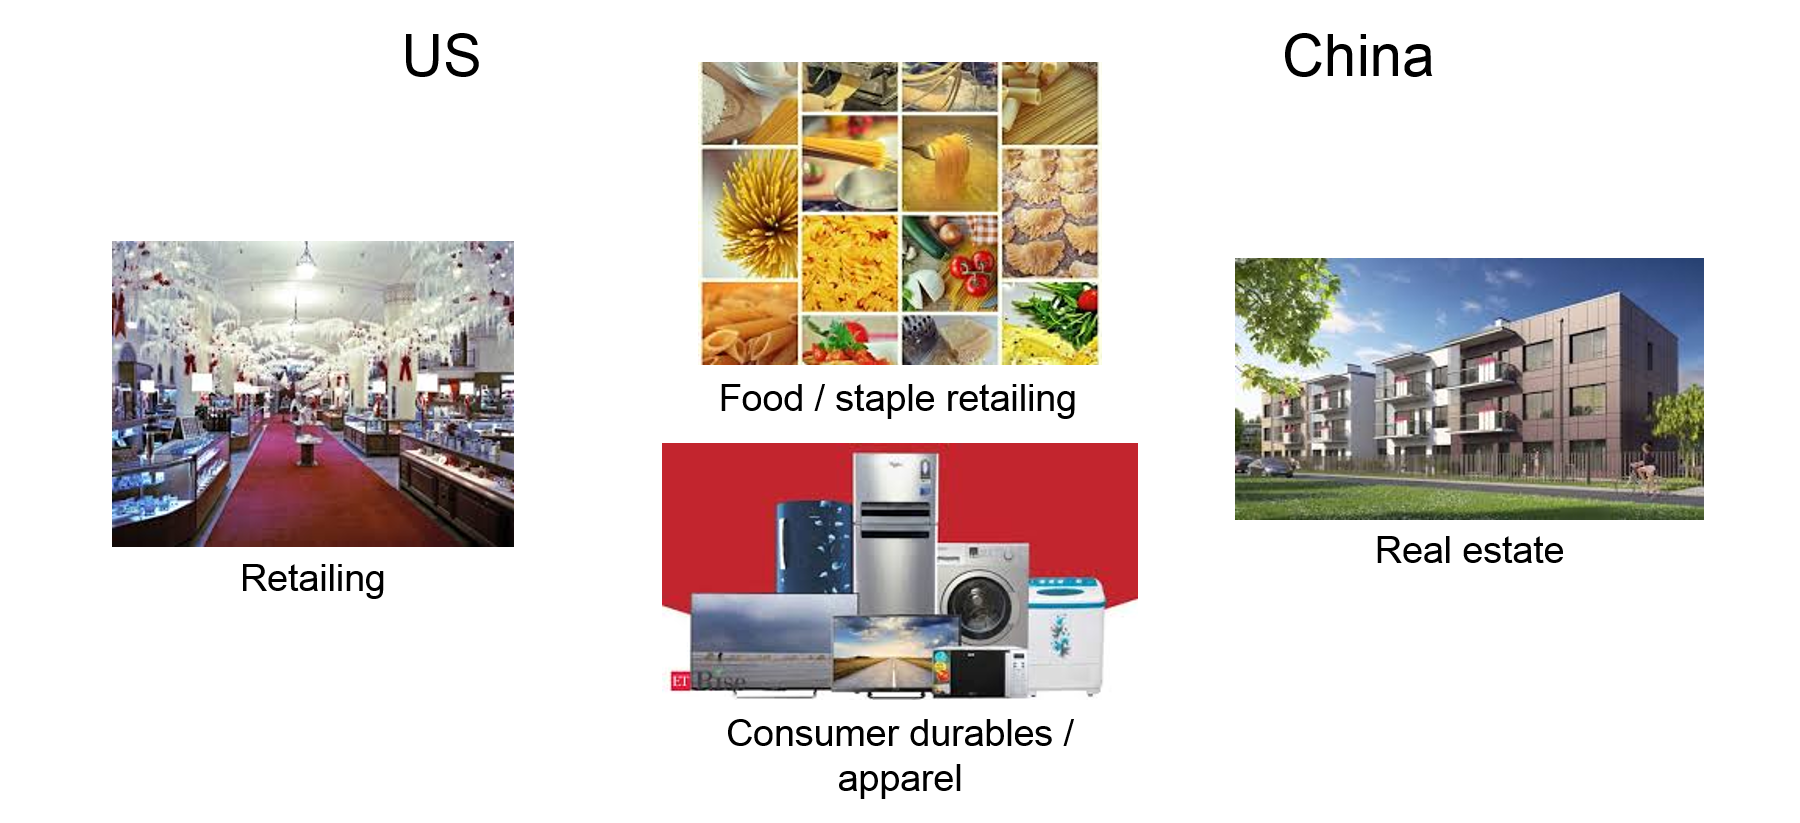
In order to take a closer look at the industries with a high % of asset in inventory, we drill deeper into a finer classification of industries for the US, that is, the level 2 industry groups, where we pick capital good, food staples retailing, retailing and food beverage Tobacco and so on. As we can see, retailing (such as department stores) has the highest percentage of asset in inventory with a median of 29%. Consumer durables and apparel (the median is 23%) is second highest (but the worst case can be 72%!), Food & Staples retailing (such as discounted stores like WMT, COSTCO, etc.) is the third highest with a median of 17%, this is followed by automobiles and components (16%) and so on.
24/58
Benchmark by KPI - China, level 2

25
Let’s do the same analysis for China, and we found that the number one industry in inventory over total asset ratio is real estate (the median 36%), and it is followed by consumer durables and apparels (the median is 15%), and capital goods (such as airplanes, heavy machinery), food staples retailing, retailing, and so on.
25/58
Benchmark by KPI - Inventory Days, US

28
To understand the importance of inventory by industry, let us look at inventory days. For US, consumer durables and apparel has a median of 120 days, a worse case of 364 days. * For food and staples retailing, the best case is 2 weeks of inventory, the average case is about 1 month, and the worst case is about two months * Pharma has the highest inventory days, with a median of 160 days and worst case about 700 days.
28/58
Benchmark by KPI - Inventory Days, China

29
* For China, consumer durable and apparel industry is doing better on inventory days than the US, * but its food and staple retailing was doing a worse job with the best case carrying about 3 weeks of inventory, average case 2 months, and the worst case about 260 days. * what is shocking is the inventory days of its real estate industry, the median ~ 1300 days and worst case > 4000 days.
29/58
Industrial Comparison (excluding financials) for US

30
We selected all level 1 industries and year 2019. The analysis compares these industries on cost efficiency, labor productivity, inventory turns and market power. The bottom left graph shows that healthcare has the lowest inventory turns, which is followed by consumer discretionary, materials, IT, consumer staples and so on. It is interesting to note that real estate in the US has an inventory turns of 9 a year for the median.
30/58
Industrial Comparison (excluding financials) for China

31
The pictures in China look different. In 2019, real estate in China has a median inventory turn of about 0.27, which is equivalent to about 1300 days of inventory! You can observe other interesting things such as labor productivity defined to be revenue over # of employees, china is much lower on labor productivity than the US in all industry sectors.
31/58
Industrial Trend - Efficiency - US

32
What we just saw is a snapshot in time, how does inventory change over time? For the US, healthcare consistently has the highest inventory days throughout recent years, which is followed by IT and consumer staples. Energy has the lowest inventory days.
32/58
Industrial Trend - Efficiency - China

33
For China, real estate consistently has the highest inventory days throughout recent years, which is followed by healthcare. Telecom has the lowest inventory days.
33/58
Inventory in the food supply chain 2022

35
The answer is clearly industry dependent. For example, let’s look at the world’s food supply chain. The retailers have a large amount of inventory and likely inventory problems. Other industries such as auto manufacturers and brewers!
35/58
Inventory in technology supply chain, 2022

36
For technology supply chain, the upstream, semiconductor equipment, has a higher median inventory $ than (and likely inventory problems) than semiconductors, followed by computer & electronics retail.
36/58
Value Driver Analysis: inventory turnover vs operating cost / revenue, retail, SP500, USA

38
We select the retailing industry (SP500 firms), for example, and years from 2018 to 2021. We observe that as inventory turnover increases, the operating cost over revenue ratio decreases for this industry, which implies that a higher inventory turnover may lead to a lower operating cost for retailing.
38/58
Value driver analysis: inventory turnover vs gross margin for retail, US, SP500

39
For the same analysis, we chose the y variable to be net margin, and we found that, interestingly, as inventory turnover increases, the net margin may decrease, which may come from a higher COGS for the products due to perhaps the loss of scale economies in buying less bulk.
39/58
Value Driver Analysis: inventory turnover vs asset turnover, SP500

40
As inventory turnover increases, the asset turnover increases for US retailing
40/58
Enterprise Ranking by inventory days for US retailing

43
Amazon is the best with the smallest inventory days of 31 days. While Macy’s ranks 18th with an inventory days of more than 120 days.
43/58
Enterprise Comparison: Amazon vs Macy's on efficiency

44
Amazon outperforms Macy's in operating cost over total revenue ratio, cash conversion cycle, and inventory days, Macy's outperforms Amazon in asset turnover and the receivable days / payable days ratio. Specifically, Macy's payable days is 10x its receivable days, and Amazon’s payable days is 4x its receivable days. This means Macy’s suppliers may have to wait a much longer time to get paid than Amazon’s suppliers.
44/58
Enterprise Comparison: Amazon vs Macy's on size

45
Amazon is much bigger than Macy's in every dimension
45/58
Enterprise Trend on efficiency: Amazon vs Macy's

46
Amazon has not only shorter inventory days but also shorter cash cycle than Macy's. Amazon is also more productive than Macy’s for most time and treats suppliers better. Amazon's labor productivity dropped during pandemic due to over-expansion, but it is improving.
46/58
Enterprise Trend on growth: Amazon vs Macy's

47
Amazon grew faster in revenue, operating income and net income in all years except 2022 during which the pandemic is over, and brick-mortar stores had a huge rebound.
47/58
Enterprise Breakdown - Revenue 2019

48
We can use revenue breakdown to understand their pricing and cost structure. For US retailing, average COGS is 71% of revenue, SGA cost 20%. Macy’s is one extreme, much lower COGS (60%, high pricing), and much higher SGA (35%, operating cost). Amazon is the opposite extreme, much higher COGS (86%, lower pricing), and much lower SGA cost (8.6%). For an item costing $100, an average retail price is $139, the retail price of Macy’s is $169, and the retail price of Amazon is $116.
48/58
Enterprise Breakdown - Detailed Assets 2019

49
For US retailing, Industry average 20.7% of inventory in total assets, Macy’s 27.4%, Amazon 9.1%. Macy’s clearly has more inventory than its peers - indicating an inventory problem. Amazon, on the other hand, is performing quite well on inventory mgmt.
49/58
KPI Examination for Amazon within retailing

53
Amazon: quite profitable, fine health, highest growth, very efficient
53/58
KPI Examination for Macy's within retailing

54
Macy's: equally profitable, fine health, little growth, not efficient.
54/58
Industrial Trend: China vs US on real estate efficiency

55
Now let’s take a closer look at the inventory days for real estate in China. The graph on the top left corner shows that China’s real estate industry carries way too much inventory with a median inventory days to be more than 1200 days. Consequently, the median cash conversion cycle is in the range of 600 to 800 days, as shown by the top right graph. The graphs on the bottom show that the asset turnover and return on asset are comparable for real estate industries between US and China.
55/58
Industrial Trend: China vs US on retailing efficiency

56
US retailing carries more inventory than China but has a higher asset turnover and ROA due to a higher margin.
56/58
Benchmark by KPI: inventory days, US selected industries

57
The analysis shows that the difference on inventory days can be huge for companies in the same industry. For US retailing, the median inventory days is around 90 days. The 90th percentile (the worst performing companies) is about 285 days and 5 times the 10th percentile (the best performing companies). The 90th percentile of consumer durables and apparel is even more dramatic with 372 days (more than one year of inventory) and the 10th percentile is only 59 days. Finally, the 90th percentile of food beverage tobacco is 235 days, so the products have sit in their warehouse for more than 200 days before reaching retailing firms, while the best performing companies (the 10th percentile) have only 38 days.
57/58
Industrial Trend: China vs US for retailing profitability

58
US retailing is much more profitable than China on all profit margins, such as gross margin, operating margin and net margin.
58/58


