Investment Analysis
For personal investors to beat the market average
Yao @ RBS

Amazon’s Up-Swing 2023
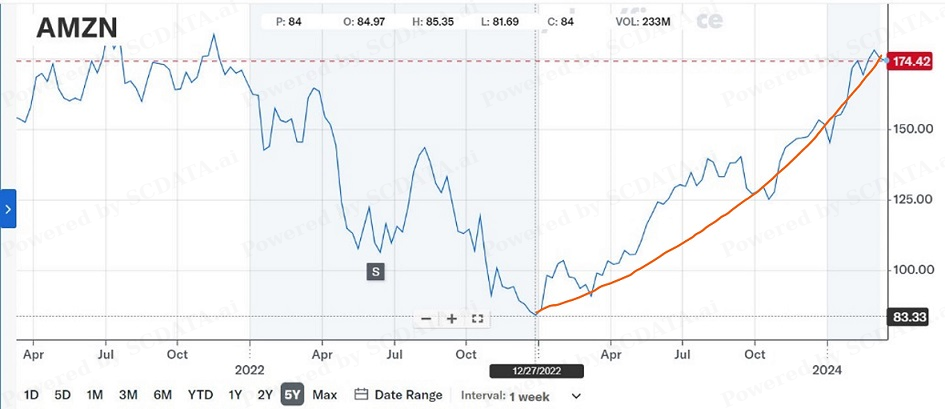
How would you know AMZN will come back rather than continue to decline?

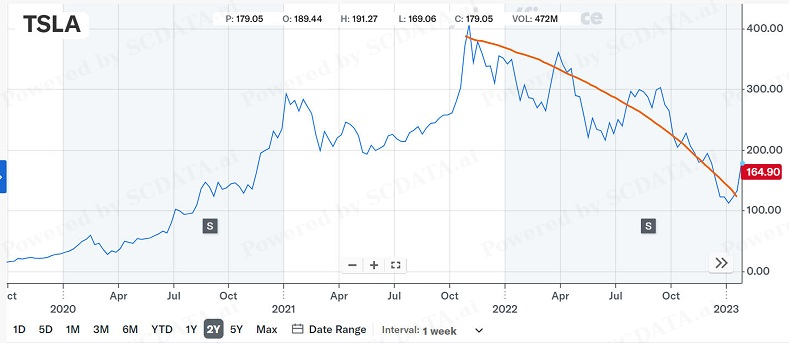
Tesla’s Down-Swing 2022

How would you know Tesla will decline substantially rather than continue to rise?

Personal investors hope to beat the stock market average while controlling risk.

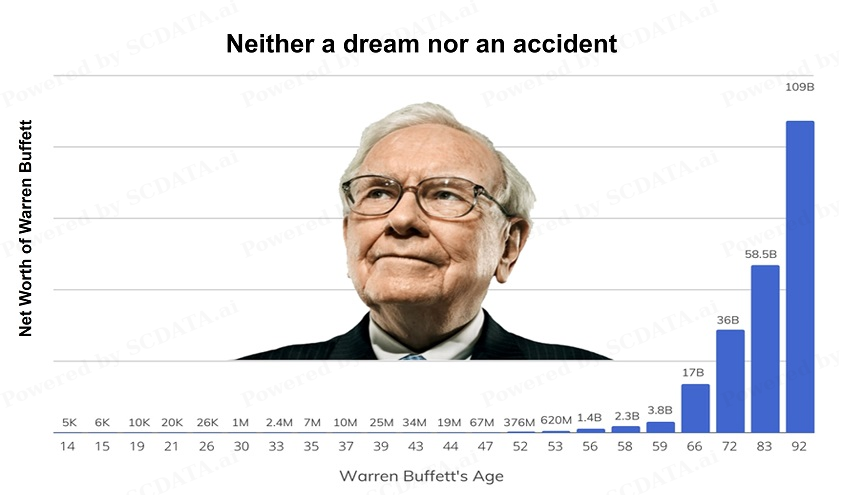
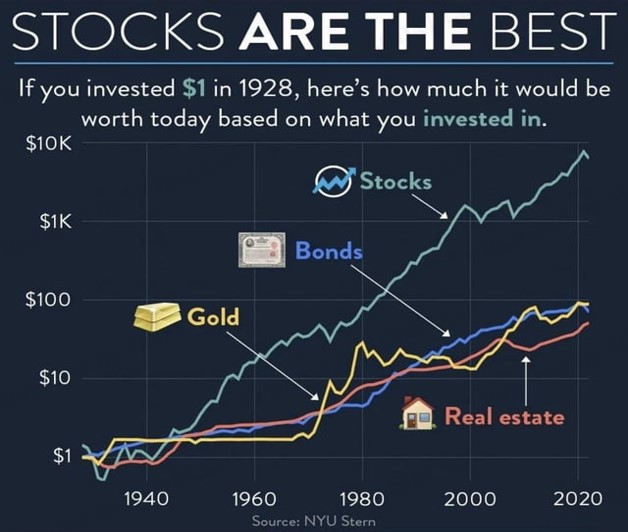
Why
Investing
in Stocks?

Why
Investment
Analysis?

Disclaimer
The information or service provided is for informational purposes only and is not intended to be personal financial advice. There's an inherent risk involved with financial decisions and the course instructor shall not be held liable for decisions others make.

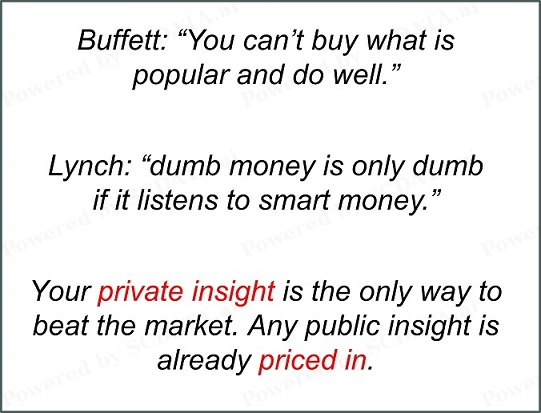
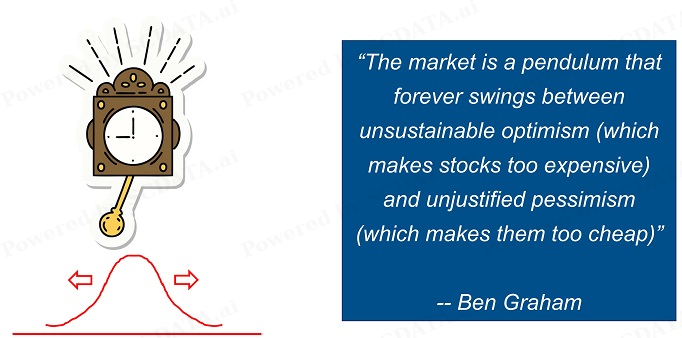
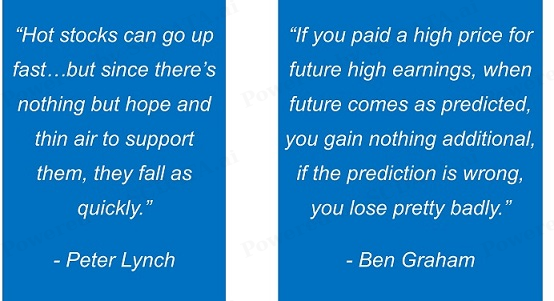
Lynch: “A share of stock is not a lottery ticket. It’s part ownership of a business.”
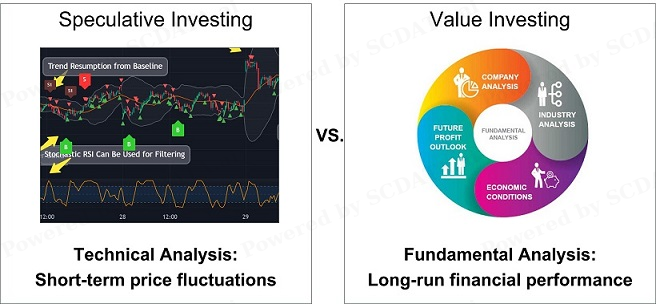

Personal Investors: Value > Speculative Investing
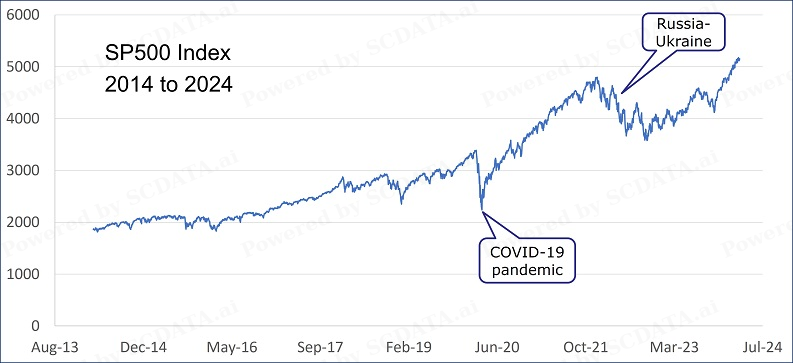

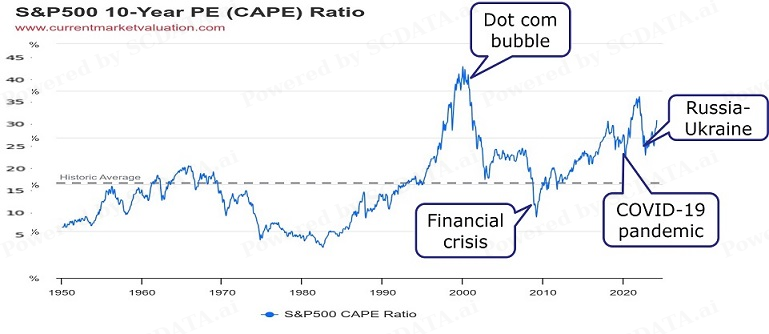
Market Transits Slowly
You got time to make investment decisions.


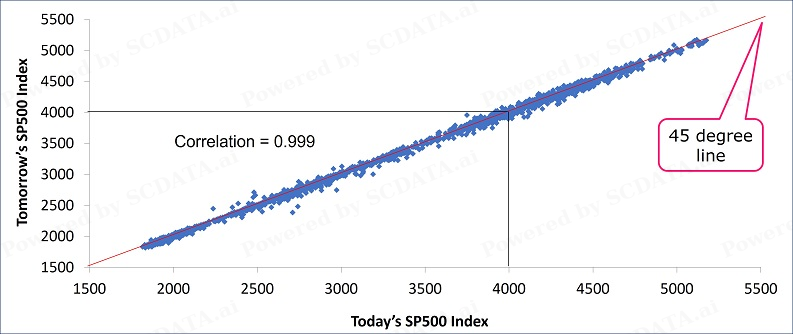
Stock Price Follows A Random Walk
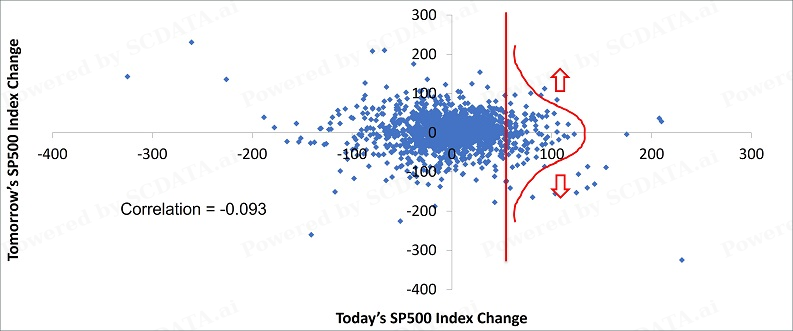
Can’t predict tomorrow’s price change by today’s price change.


Value Investing of Buffett
Rules

Industry Analysis
Identify promising industries to invest

Industry Analysis
Factors driving industry market cap?
Which industries to invest or avoid?
Which countries to focus?


Financial Performance Does Drive Market Cap

Industry Analysis
Factors driving industry market cap?
Which industries to invest or avoid?
Which countries to focus?

Type of Industry
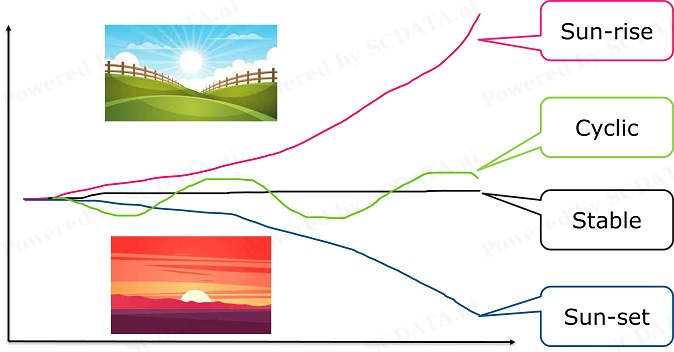

Find industries with constantly increasing market cap?
What does market cap growth depend on?

Bad news: No industry has constantly growing market cap.
Good news: Market cap growth ~ Net income growth

Avoid constantly declining industries
Different region (country) may have different ones

Industry Analysis
Factors driving industry market cap?
Which industries to invest or avoid?
Which countries to focus?

Company Analysis
Identify individual companies / stocks to invest

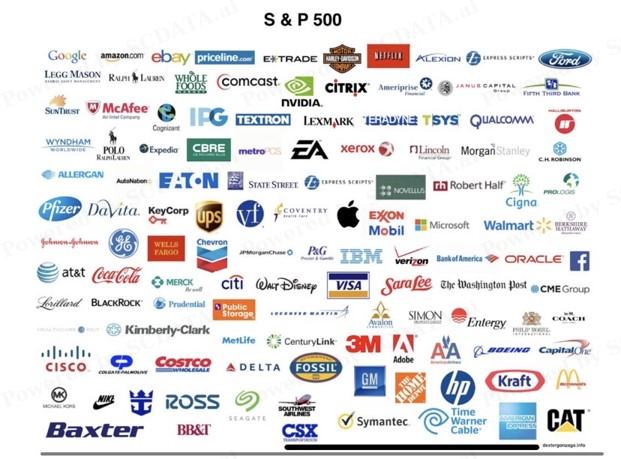
SP500 Companies
Mid-large cap
Well known
Plenty of Choices

Where to Look for Opportunities?
Three
Exploding
Stocks

Outstanding Business
Superior economic prospects

Rebound / Turnaround / Hiccups

Smaller but High Growth

Determine Fair Price (Intrinsic Value)
When to sell or buy?
Compare actual price to the fair price.

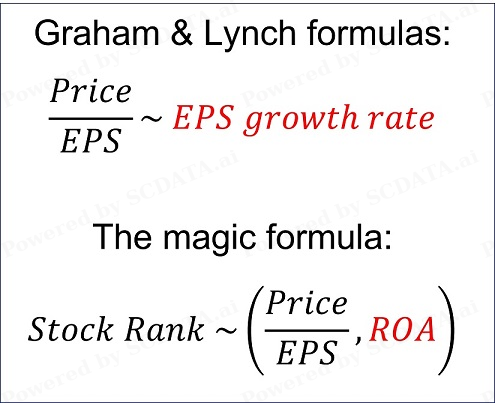
Data analysis shows:
Popular formulas
on the right are
neither Robust
nor Significant

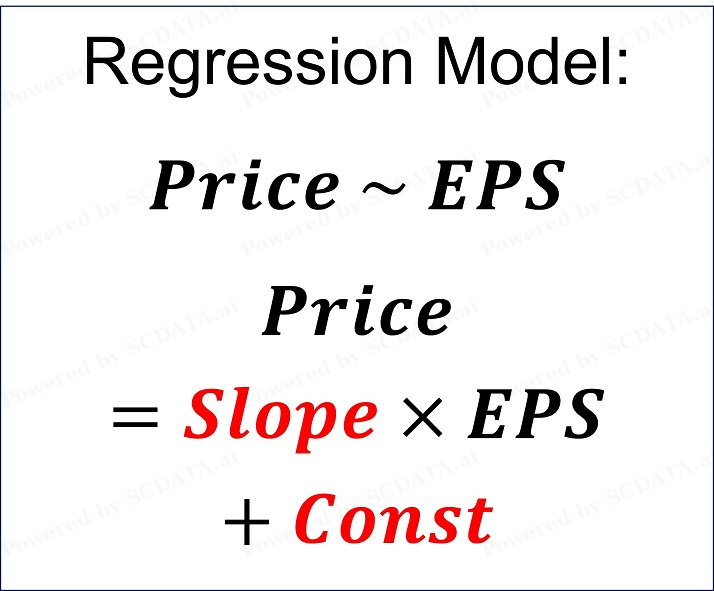
Robust &
Quite Significant
in Data

Intuition / Principle
If we knew EPS in the future, then the stock price is a fixed number:
Price = Net Present Value (NPV) of all EPS in the future 

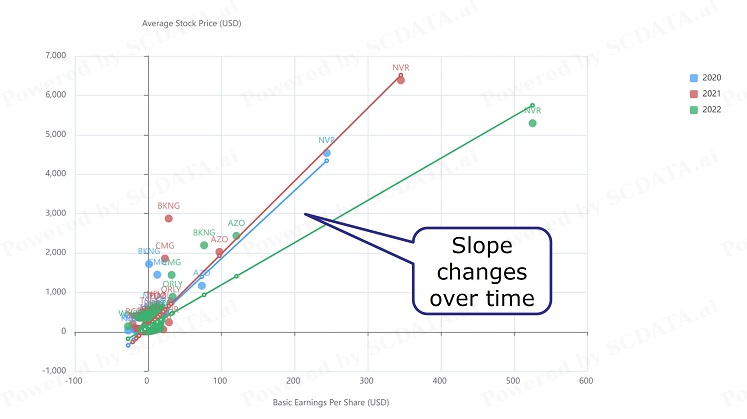
Usage of the Regression Model (RM)
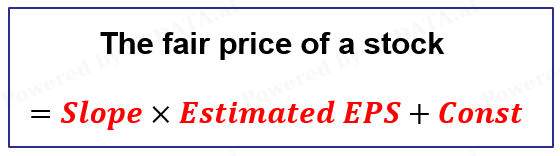
Slope: Estimated by RM, individual company or industry.
Estimated EPS: Fundamental analysis for possible scenarios.
Const: Intercept (estimated by RM) or stockholder equity / shares.
RM works if (1) make sense: positive correlation (2) statistically significant.
Significant (>50%). Moderately significant (30-50%), Not significant (<30%).
Predicting stock prices becomes predicting firms’ financials (EPS).

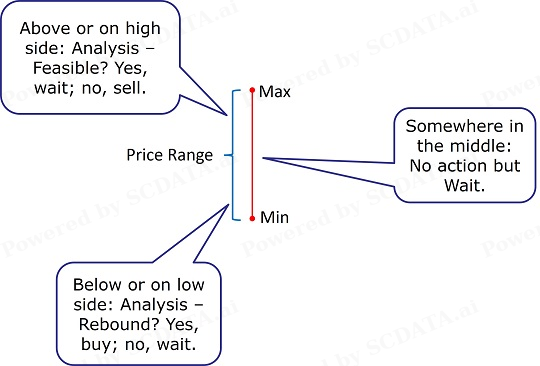
Fair Price Range
The fair price is a range, width defined by safety margin, updated over time.

Regression Model (RM) vs. Just P/E Ratio
A bit more effort for a better result

Compare the actual stock price to the fair price range
Handling
Different
Cases

Case
Studies

Semiconductors


Primary Opinion (Company Model)
|
Individual Company |
INTC |
AMD |
TXN |
|
Slope |
10.34 |
49 |
14 |
|
Intercept |
$4.09 |
$19.45 |
$55.20 |
|
Significance, R square |
0.86 |
0.91 |
0.4 |
|
EPS min $ |
2 |
0.3 |
5 |
|
EPS max $ |
5 |
4 |
10 |
|
Fair price min $ |
$24.77 |
$34.15 |
$125.20 |
|
Fair price max $ |
$55.79 |
$215.45 |
$195.20 |
|
Actual price in 1-3/2023 |
$25~30 |
$60~100 |
$170~180 |
|
|
Within, low side |
Within |
Within, high side |
AMD has a much bigger slope of 49, implying $1 change in EPS, stock price changes in $49 on average.

Under-Valued vs. Over-Valued

Comparative Valuation
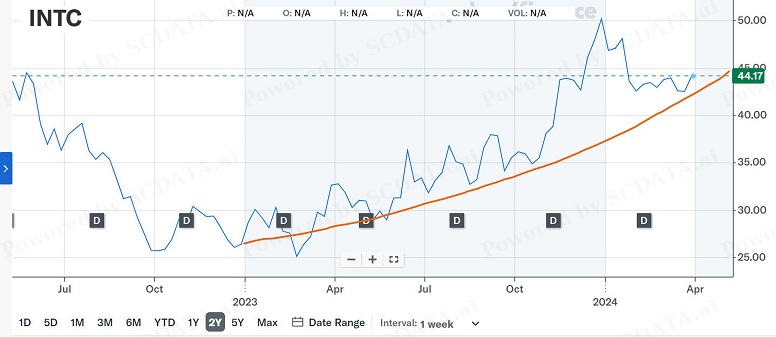
INTC vs. AMD / TXN:
INTC has much bigger revenue, net income and stockholder equity,
But same or smaller market cap!
Either INTC is under-valued or AMD / TXN are over-valued.

Intel's Come Back 2023

Retailing


Primary Opinion (Company Model)
|
Individual Company |
AMZN |
JWN |
TJX |
|
Slope |
31.33 |
2.88 |
8 |
|
Intercept |
$78.71 |
$26.47 |
$52.90 |
|
Significance, R square |
0.7 |
0.56 |
0.49 |
|
EPS min $ |
0.3 |
1 |
2 |
|
EPS max $ |
4 |
4 |
4 |
|
Fair price min $ |
$88.11 |
$29.35 |
$68.90 |
|
Fair price max $ |
$204.03 |
$37.99 |
$84.90 |
|
Actual price in 1-3/2023 |
$90-100 |
$15~26 |
$78~82 |
| Within, low side | Below | Within |
Amazon has the highest slope of $31, implying $1 change in EPS will result in $31 change in stock price on average.

Under-Valued vs. Over-Valued

Amazon 2022 Fundamental Analysis (Brief)

Amazon’s Come-Back 2023


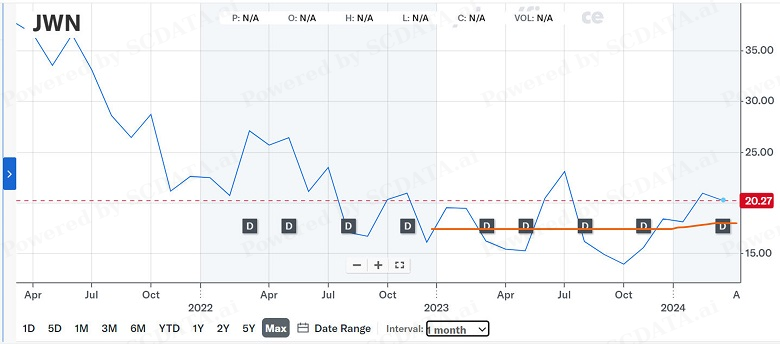
Nordstrom's No Come-Back 2023

Pharmaceutical / Bio-Tech


Primary Opinion (Company Model)
|
Individual Company |
Pfizer |
JnJ |
Merck |
|
Slope |
7.19 |
14.48 |
6.69 |
|
Intercept |
$21.10 |
$68.02 |
$55.89 |
|
Significance R square |
0.46 |
0.56 |
0.34 |
|
EPS min $ |
1.5 |
5 |
2 |
|
EPS max $ |
6 |
8 |
6 |
|
Fair price min $ |
$31.89 |
$140.42 |
$69.27 |
|
Fair price max $ |
$64.24 |
$183.86 |
$96.03 |
|
Actual price in 1-3/2023 |
$40-45 |
$150-170 |
$103-114 |
| Within | Within | Above |

Under-Valued vs. Over-Valued
Is Merck Over-valued?
Over-value analysis:
Price back-track to EPS: by individual RM, Merck needs an EPS of $8 to achieve the price of $109.
EPS × Shares --> Net Income ≥ $20.3B.
Net Income / Net Margin --> Total Revenue ≥ $81B.
Is this feasible?

Over-Value Analysis of Merck: Not Infeasible but Challenging
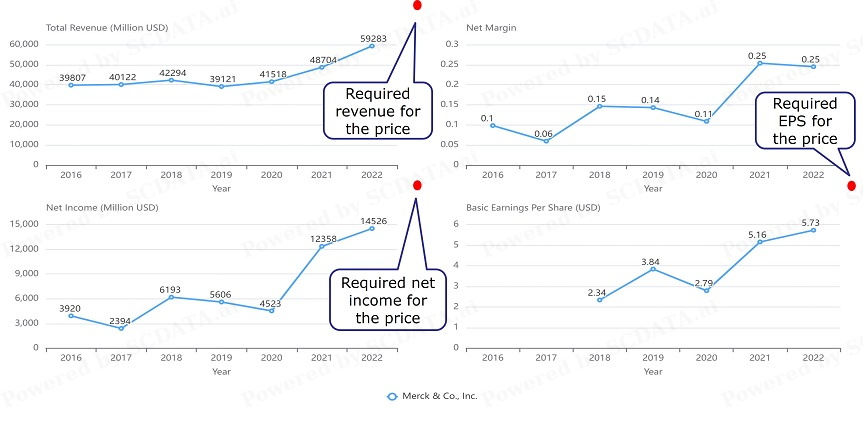
Since the RM model is only moderately significant, either sell or hold is fine but sell may be a better choice.

Merck: A Laggard For Seven Months*
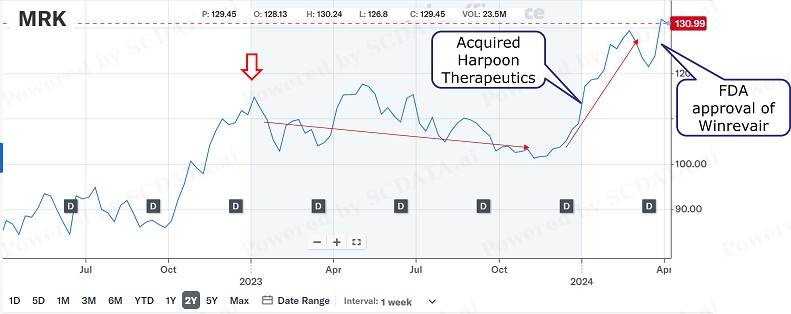
* https://www.investors.com/news/technology/merck-stock-is-it-finally-time-for-this-2023-laggard-to-stage-a-comeback/

Automobile


Primary Opinion (Company Model)
|
Individual Company |
GM |
Ford |
|
Slope |
4.52 |
2.28 |
|
Intercept |
$16.54 |
$9.72 |
|
Significance R square |
0.21 |
0.73 |
|
EPS min $ |
4 |
0 |
|
EPS max $ |
7 |
4.5 |
|
Fair price min $ |
$34.62 |
$9.72 |
|
Fair price max $ |
$48.18 |
$19.98 |
|
Actual price in 1-3/2023 |
$33-43 |
$11~14 |
| Within | Within |
The regression model for GM is not significant.

Market’s Over-Reaction to Tesla
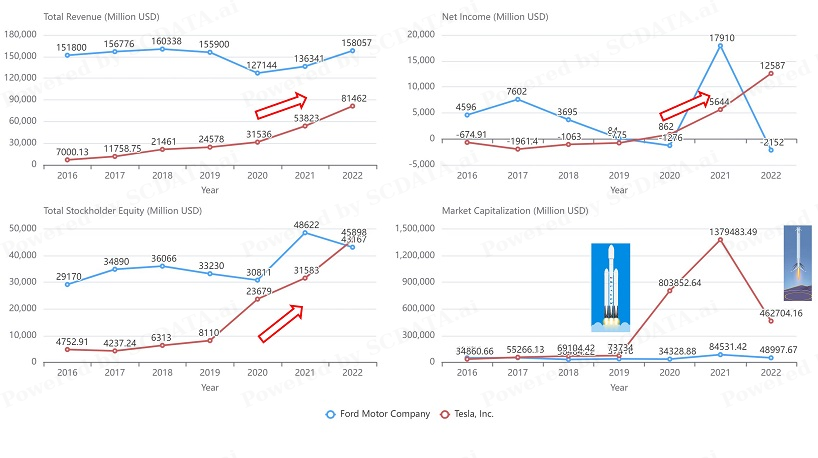
Tesla was a smaller but high growth company. The market over-reacted to the rise of Tesla in 2020-21 and made a correction in 2022. The regression model does not work for Tesla due to market speculations.


Tesla’s Down-Swing 2022

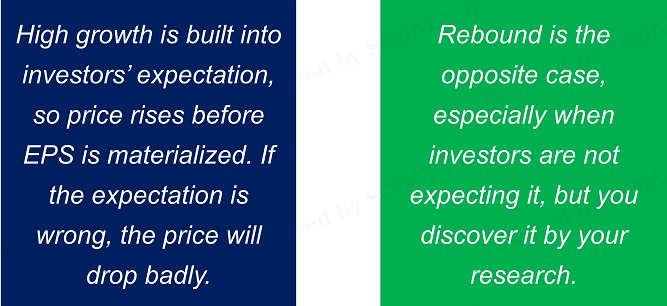
High Growth vs. Rebound


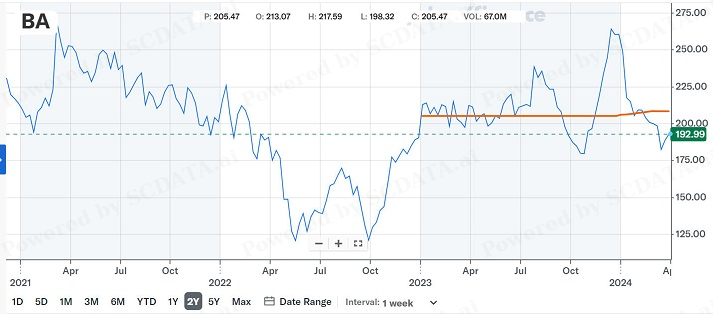
Capital Goods


Primary Opinion (Company Model)
|
Individual Company |
GE |
BA |
Deere |
|
Slope |
1.33 |
4.11 |
15.18 |
|
Intercept |
$81.04 |
$264.27 |
$65.70 |
|
Significance R square |
0.59 |
0.8 |
0.85 |
|
EPS min $ |
0 |
0 |
7 |
|
EPS max $ |
5 |
20 |
25 |
|
Fair price min $ |
$81.04 |
$264.27 |
$171.96 |
|
Fair price max $ |
$87.69 |
$346.47 |
$445.20 |
|
Actual price in 1-3/2023 |
$70-95 |
$200-210 |
$400-430 |
| Overlap | Below | Within |

Under-Valued vs. Over-Valued

The Market Hasn’t Figured Out … Neither Did I

Word of Caution
No models / formulas always work in stock markets!
Even if the regression models work (positive correlation, significant), they only reflect the past.
The regression models ignore many factors; so if they don’t work, do not use them.
There are always exceptions to the comparative valuation.


Despite all odds, there are patterns in data that we can discover & use to beat the market average as a personal investor while controlling risk.