Sourcing Analytics: A Practitioner's Playbook
A Playbook for Identifying and Selecting Suppliers
Drs. Kathleen Iacocca, Anh Ninh, Yao Zhao

Data Analytics Is Critical

Sourcing Analytics Playbook

Objectives

An Illustrative Example: Apple's iPhone
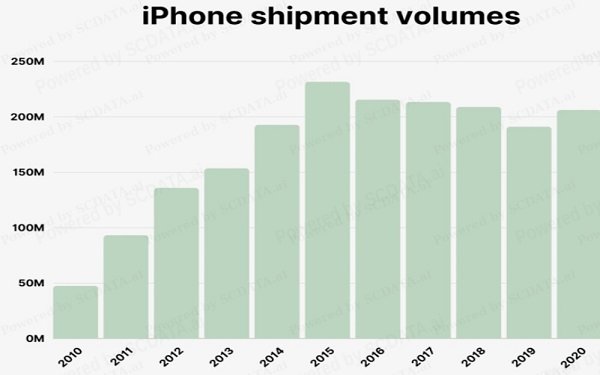
We will use the iPhone as an illustrative example. The iPhone was the first touch screen phone and was highly popular. Its success has yielded high profits through the present day. From 2007 to 2010, Apple made $27 billion with a profit of $15.6 billion (Rafique et al, 2014).

Apple's Global Supply Chain
Apple designs and sells the iPhone, but outsources a majority of the manufacturing.
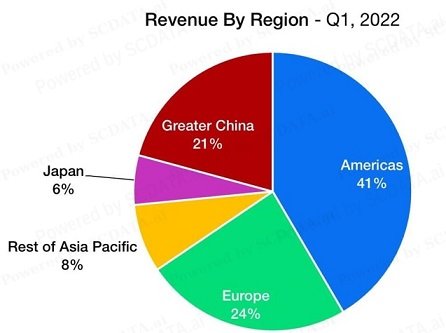
Apple’s global supply chain engages thousands of suppliers in over 50 countries.
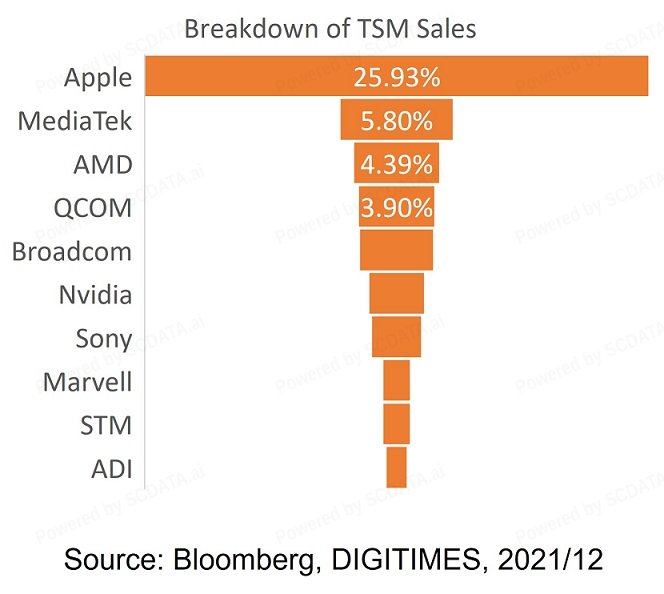
The picture below shows the share of iPhone revenue by different countries / regions.

When suppliers become competitors...
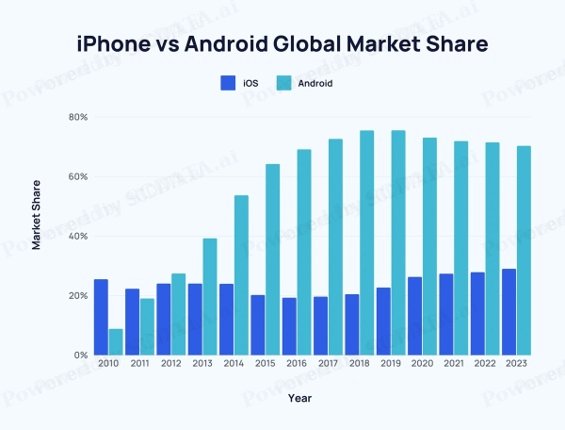
Samsung was a supplier of Apple before it became a major competitor, taking over the global market as shown below. This further highlights the importance of Apple’s supplier selection to ensure its continued success, especially with critical components such as CPU chips.

How to Continue the Success?
Identify and select new suppliers

Step 1: Assess Needs and Define
Supplier Selection Criteria


CPU Supplier Selection Criteria
Apple’s strategic focus over the past two decades includes innovation, product quality, and brand loyalty (Meyer, 2024).
Combining this knowledge with Apple’s placement in the market and revenue breakdown, we can identify that Apple’s selection criteria will be companies that can support their production quota (COGS) and innovative design (R&D). These criteria can be summarized as:

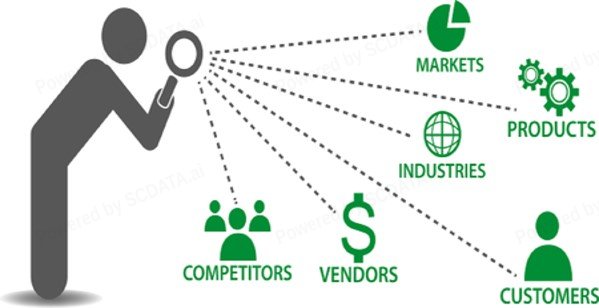
Step 2: Identify Potential Suppliers
Analyze supplying industry to identify the right suppliers and their offerings.


Top potential countries to select suppliers
Location, location, location

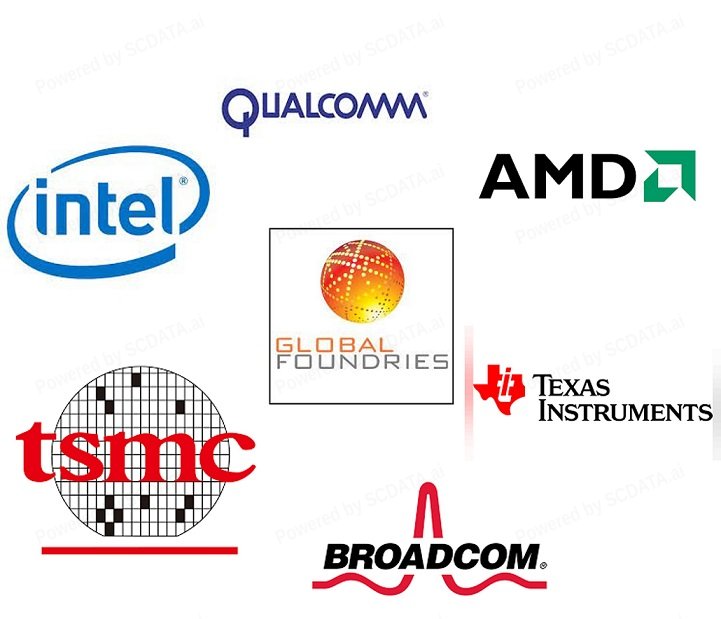
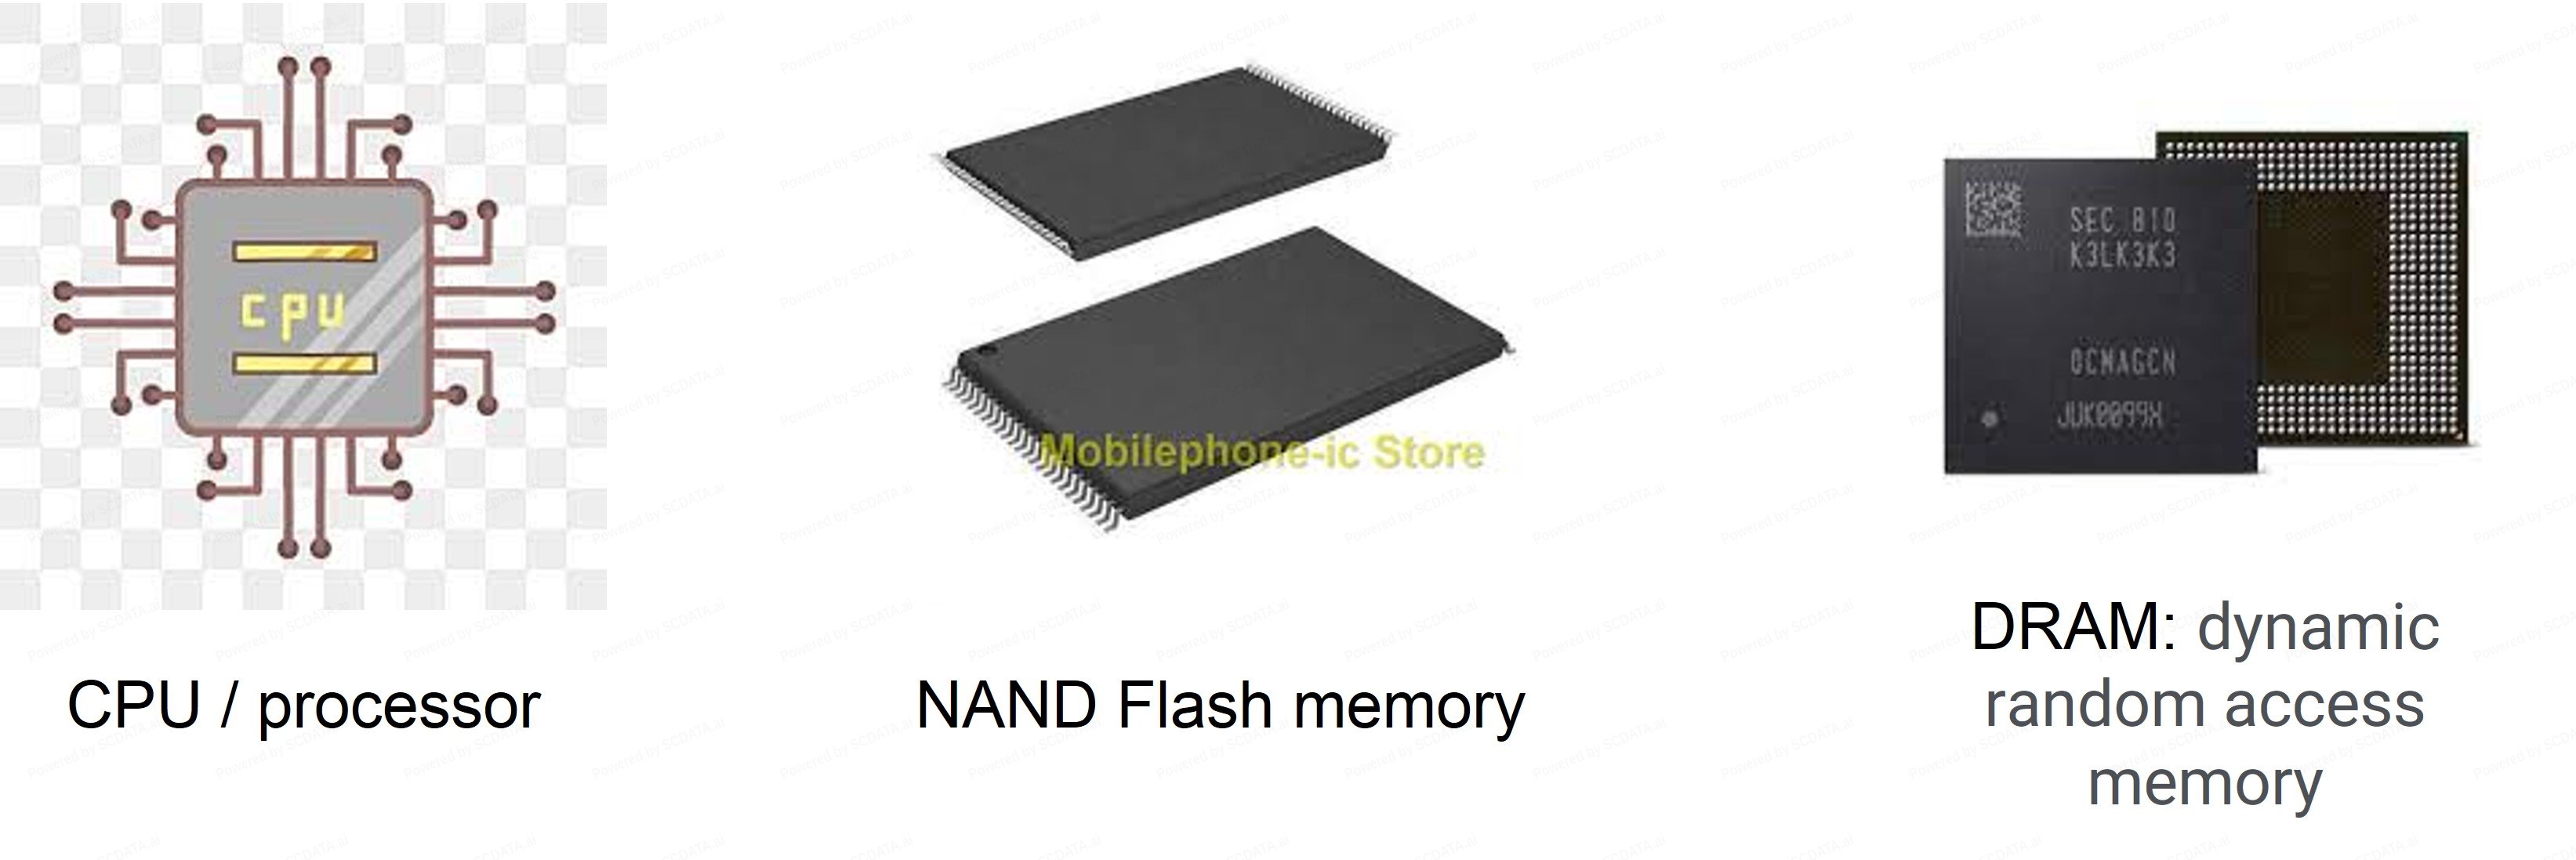
Potential Suppliers for CPU / Processor

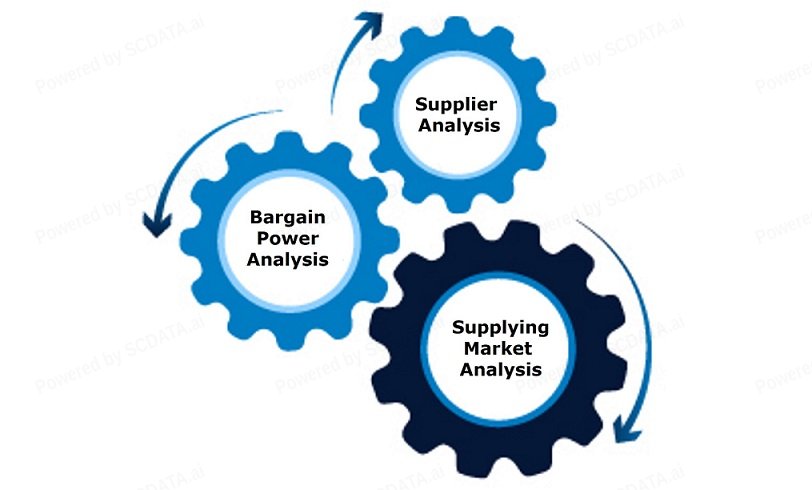
Step III: Bargaining Power Analysis
Knowing your suppliers: Who has the bargain power? What is your leverage?


Bargaining Power Analysis – Intuition
If I buy 50% of your volume which is 5% of my spend in this category, I have power over you.
If I buy 5% of your volume but that is 50% of my spend in this category, you have power over me.

Leverage Calculation
Consider a buyer, a supplier and a category:
Buyer leverage = buyer’s spend on the supplier as a % of the supplier’s sales.
Supplier leverage = buyer’s spend on the supplier as a % of the buyer’s total spend in the category.
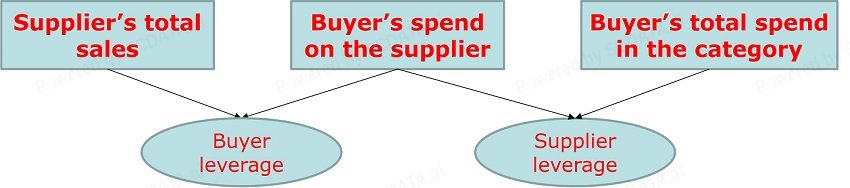

Bargaining Power Index
BPI = buyer leverage / supplier leverage = buyer’s total spend in the category / supplier’s sales
If BPI << 1, supplier has the bargain power because the buyer needs the supplier more than the other way around.
If BPI >> 1, buyer has the bargain power because the supplier needs the buyer more than the other way around.
If BPI ~ 1, the bargain power is balanced, they need each other equally.

Apple 2022 Bargaining Power Index (BPI with Semiconductors Suppliers
|
Semiconductors |
Apple’s spend $M |
Suppliers’ Revenue $M |
BPI |
|
IC total |
67060 |
||
|
ADVANCED MICRO DEVICES (AMD) |
23601 |
2.84 |
|
|
GLOBALFOUNDRIES (GFS) |
8108 |
8.27 |
|
|
INTEL (INTC) |
63054 |
1.06 |
|
|
QUALCOMM (QCOM) |
44200 |
1.52 |
|
|
TEXAS INSTRUMENTS (TXN) |
20028 |
3.35 |
|
|
BROADCOM (AVGO) |
33203 |
2.02 |
|
|
TAIWAN SEMICONDUCTOR MANUFACTURING CO (TSM) |
73868.23 |
0.91 |
TSMC has more leverage than Apple, INTEL ~ Apple, Apple has more leverage over others

Step 4: Supplier Analysis
Price, Profitability, Operational Efficiency
Short-term / long-term liabilities and risks
Production / supply chain capabilities
Objectives: identify the best suppliers meeting the criteria; support negotiation and bargaining

Pricing / Profitability Analysis

Financial Health Analysis: Short-term and Long-term Liabilities and Risks
For critical parts, you need the suppliers to have a rock-solid financial health.

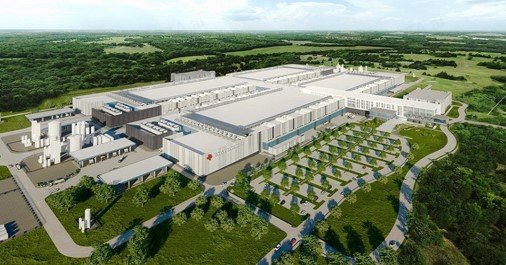
Production & Supply Chain Capabilities
Production capability: Does the supplier have sufficient production capacity, i.e., PPE (property, plant, equipment)?

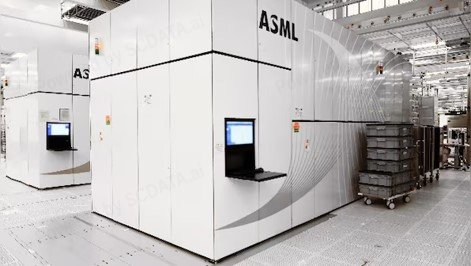
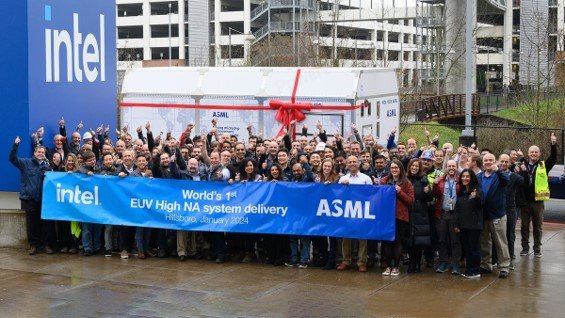
Supply Chain Capability: World’s 1st EUV High NA Went to INTC
Intel is one of the largest shareholders of ASML: 15% 2012, 3% 2023.
Samsung’s share: 1.6% 2023.
TSM’s share: 0% 2023

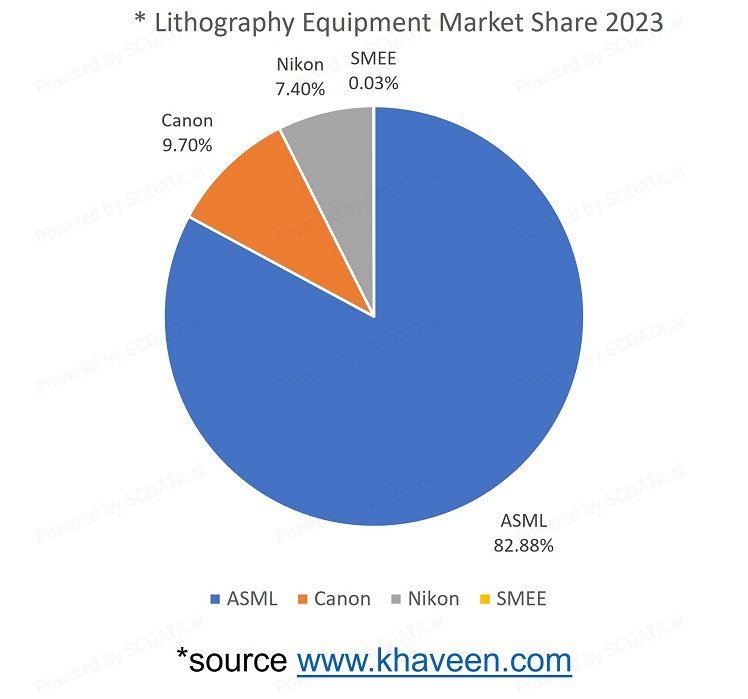
Semiconductors Supply Chain Bottlenecks
Bottleneck 1: Lithography Equipment. ASML backorder 1.4 years.

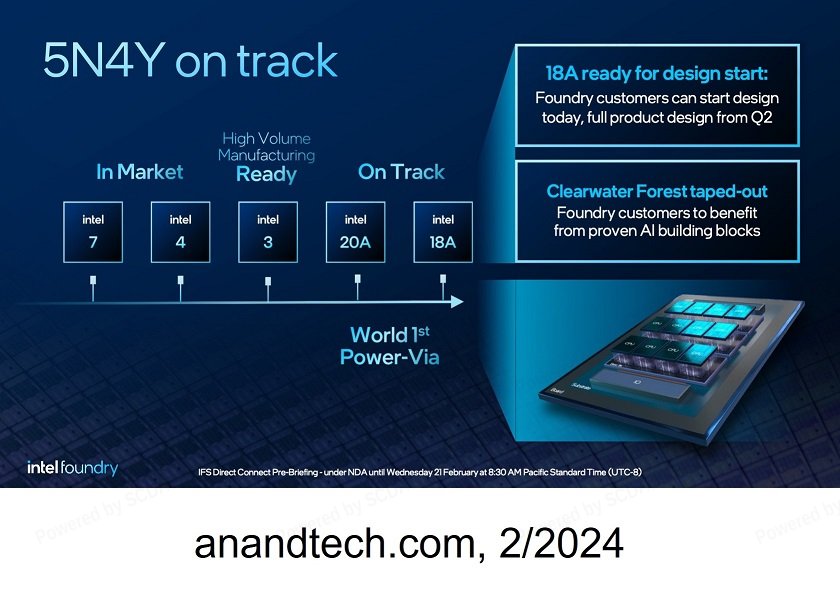
Intel Foundry Services (IFS)
Intel foundry (IFS) is advancing its process to the 2nm by 2024.

Supplier Scorecards
Select the best supplier(s) to meet the selection criteria

Summary scorecard
|
Intel |
QCOM |
GFS |
TSM |
AVGO |
AMD |
TXN |
|
|
Innovative, technological / engineering capability |
Excellent |
Excellent |
Good |
Excellent |
Excellent |
Excellent |
Excellent |
|
Manufacturing / supply chain capability |
Excellent |
Fair |
Good |
Excellent |
Poor |
Poor |
Good |
|
Pricing |
Excellent |
Fair |
Excellent |
Fair |
Poor |
Excellent |
Poor |
|
Profitability |
Fair |
Good |
Fair |
Excellent |
Excellent |
Fair |
Excellent |
|
Bargain power |
Excellent |
Fair |
Excellent |
Poor |
Good |
Good |
Good |
|
Financially healthy / robust |
Excellent |
Good |
Excellent |
Excellent |
Good |
Excellent |
Excellent |
|
Leaks & competition |
Excellent |
Good |
Excellent |
Excellent |
Excellent |
Excellent |
Excellent |

2022 CPU Sourcing Strategy for Apple iPhone