Inventory is not evenly distributed among countries

4
Inventory is not evenly distributed among countries. China, US and Japan carry the most inventory in 2024.
4/38
Inventory is not evenly distributed among countries

5
Bar chart shows clearly that China's inventory is nearly twice as much as that of the US, Japan is the third, and they are followed by Germany, South Korea, France, India and Taiwan, for which inventory is also important.
5/38
Enterprise Distribution - Enterprise Distribution

6
Guangdong, HK and Beijing: highest inventory.
6/38
Enterprise Distribution - Enterprise Distribution

7
Texas, California, and Virginia had the most inventory.
7/38
Enterprise Distribution - Enterprise Distribution

8
Tokyo, Osaka, and Aichi had the most inventory.
8/38
Inventory Problems Persist Over Time - Inventory / Total Assets

12
Although inventory is unevenly distributed by country, industry and company, it is quite persistent over time. If an industry had inventory issues in the past, it tends to have such issues in the future. For the US, Consumer Discretionary consistently has the highest median inventory over total assets, it is followed by consumer staples. Real estate has the lowest median inventory over total assets over time.
12/38
Inventory Problems Persist Over Time - Inventory / Total Assets

13
For China, real estate consistently has the highest inventory over total assets throughout the years, which is followed by consumer staples. Energy has the lowest inventory / total assets.
13/38
Inventory is not evenly distributed among industries

14
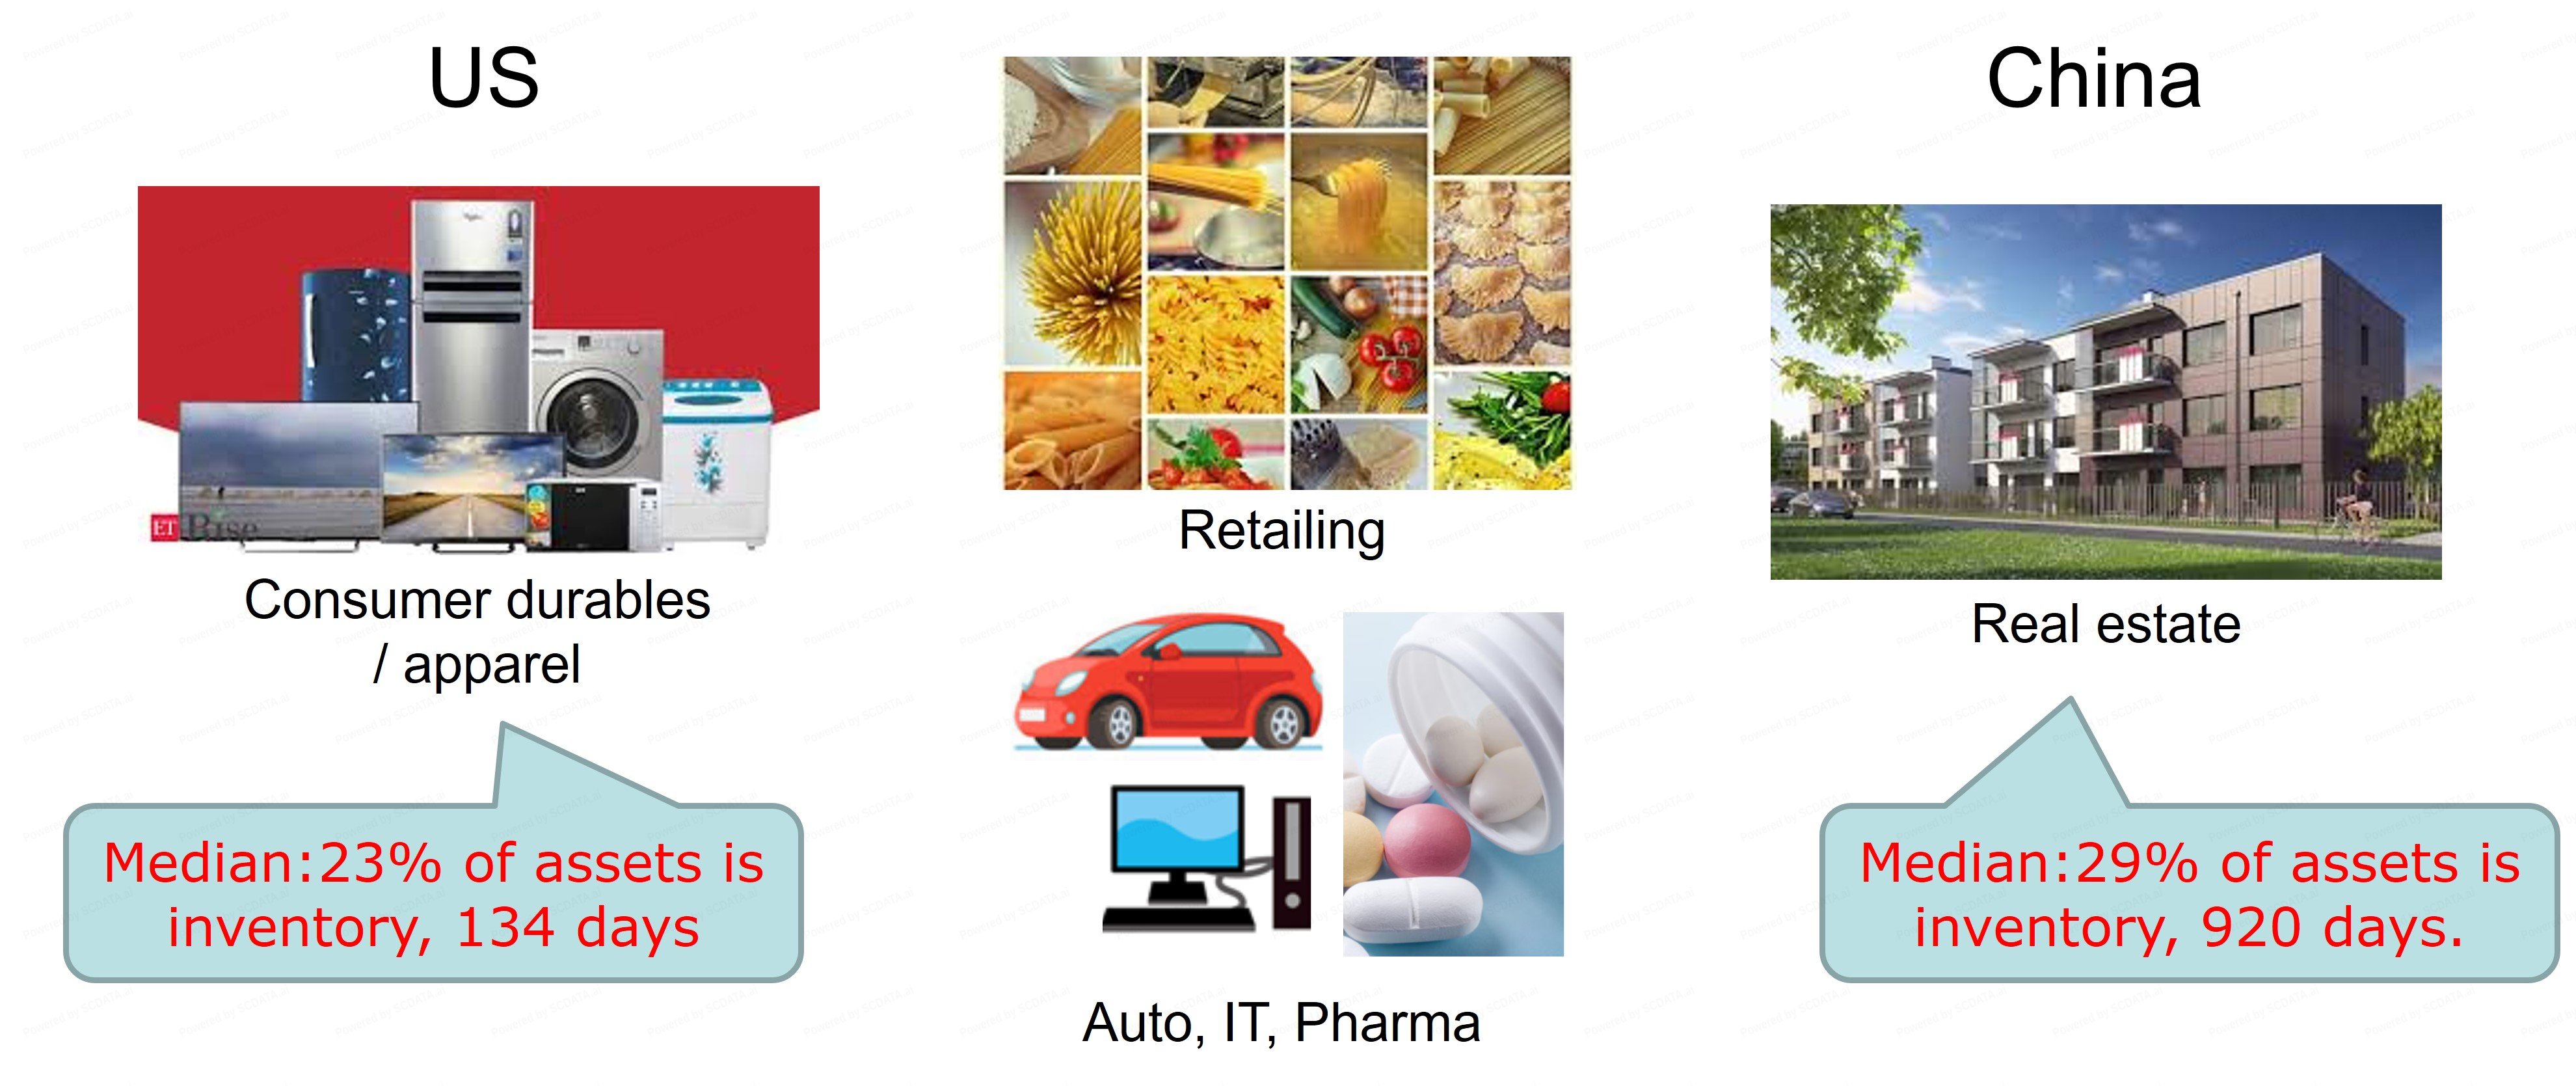
Inventory is not evenly distributed among industries. For the US, consumer durables / apparel and retailing hold the highest inventory over total assets. The worst case of consumer durables / apparel is far worse than that of retailing. Companies in these industries need to pay attention to inventory. They are followed by automobile and parts, food and staples retailing, food, beverage tobacco, tech hardware and semiconductors. On the other hand, Banks, Software & Services, and Real Estate had little inventory for an average firm, so inventory is not relevant for them.
14/38
Inventory is not evenly distributed among industries

15
For China, similar observations can be made but two important differences: real estate in China has high inventory, retailing in China has lower inventory …
15/38
Inventory is not evenly distributed among companies

17
Inventory is not evenly distributed among companies within the same industry. For example, consumer durables / apparel median of 134 days, a worse case of 368 days. For food and staples retailing, the best case is 2 weeks of inventory, the median case is about 1 month, and the worst case is about 3 months * For Pharma, although inventory does not account for a significant % of the total assets but it had the highest inventory days – inventory is important.
17/38
Inventory is not evenly distributed among companies

18
Similar observation applies to China where retailing median case is better than the US, but the worst case is much worse. Food and staple retailing – a bigger problem than the US. Pharma: similar problems as the US. Real estate – the worst case …
18/38
Inventory Problems Persist Over Time - Inventory Days

19
Although inventory is unevenly distributed by country, industry and company, it is quite persistent over time. If an industry had inventory issues in the past, it tends to have such issues in the future. For the US, Healthcare consistently has the highest inventory days, it is followed by IT and consumer staples. Energy has the lowest inventory days.
19/38
Inventory Problems Persist Over Time - Inventory Days

20
For China, real estate consistently has the highest inventory days throughout the years, which is followed by healthcare. Energy has the lowest inventory days.
20/38
Inventory along the food supply chain

22
The answer is clearly industry dependent. For example, let’s look at the world’s food supply chain. The retailers have a large amount of inventory and likely inventory problems.
22/38
Inventory along the pharma supply chain

23
For pharma supply chain, also the downstream, drug retail, has a higher median inventory $ than upstream distributors and drug-makers.
23/38
Faster inventory turnover reduces SGA cost for US retailing

26
For the US retailing, as inventory turnover improves, SG&A cost over revenue may decrease. Similar slopes for different years. This may implies that improving inventory management can help reducing SGA cost (or operating cost) for retailing!
26/38
Cheaper products sell faster for US retailing

27
Items with lower-pricing sell faster. Another strong correlation was found for US retailing is between gross margin and inventory turnover. Intuitively, lower gross margin means lower-pricing items, which are more attractive to customers and thus moves faster (fast movers), and inventory turns are high. The observation is quite time independent.
27/38
Price discounts increase sales at different speed.

28
The observation, “cheaper products sell faster”, holds true also for other industries. However, they tend to have different slope: Cheaper products increase sales at different speed.
28/38
Enterprise Ranking - Inventory Days

31
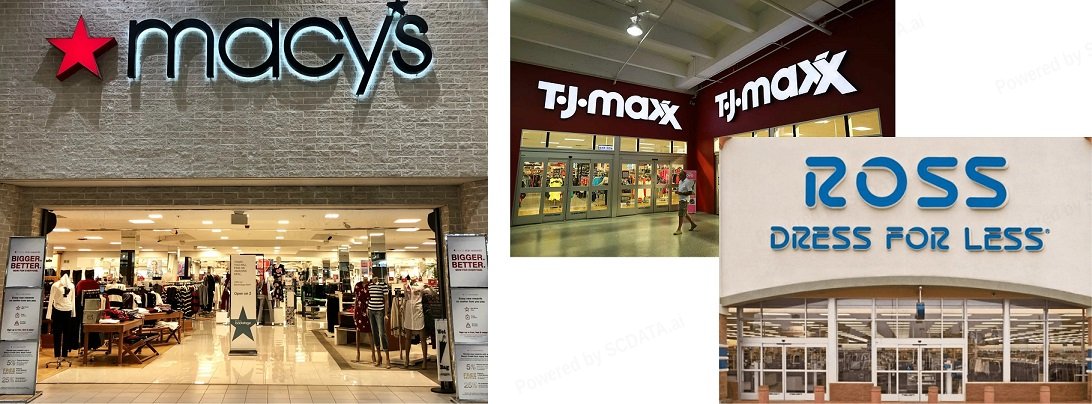
Ranking all US SP500 department stores and apparel retailers by inventory days, we can see that Ross stores 3rd, TJX 4th, Macy’s 22th.
31/38
Macy’s vs. Ross vs. TJX: Enterprise Trend

32
Trend analysis provides a more comprehensive picture. Macy’s had constantly higher inventory days than TJX and Ross Stores. Macy’s also had the highest gross margin implying the highest pricing, which likely resulted in the lowest revenue growth. With the highest pricing, Macy’s made the lowest net margin.
32/38
Enterprise Breakdown - Revenue, US retailing 2024

33
Revenue breakdown shows how did Macy’s make the lowest net margin with the highest gross margin (pricing). Answer: Macy’s had a much higher SG&A cost than others. What contributed to Macy's high SG&A cost?
33/38
Enterprise Breakdown - Detailed Assets, US retailing 2024

34
Assets breakdown provides the answer. For US retailing, Industry average 15% of inventory in total assets, Macy’s 27%, TJX 20%, Ross Stores 15%. Macy’s clearly had an inventory problem, Ross Stores unlikely. Recall the financial analysis: faster inventory turns reduce SG&A cost. So inventory likely contributed to Macy's high SG&A.
34/38
Faster inventory turn reduces SGA cost.

36
In fact, Macy’s data itself supported the insight. Using the latest 5 years’ data, we can see a fair strong negative relationship between inventory turnover and SG&A cost. Caution: the relationship is weak if we include all data from 2016 to 2024 possibly due to different situation before and after the pandemic. Same observations can be made for Nordstrom and TJX, but not significant for Ross stores possibly because it’s already very lean.
36/38
Enterprise Trend - Net income vs. Market Cap

37
Because Macy’s market value co-moved with its net income, if its net income is improved by inventory mgmt., its market value will also improve.
37/38