SCDATA
Update
SCDATA
Update
SCDATA
Update
SCDATA
Update
Chipotle
Competitive Intelligence and Benchmarking
Lily Chan
Supply Chain Analytics
Rutgers Business School

Battle of the Restaurants

Chipotle

Stock Market Performance 2025 YTD
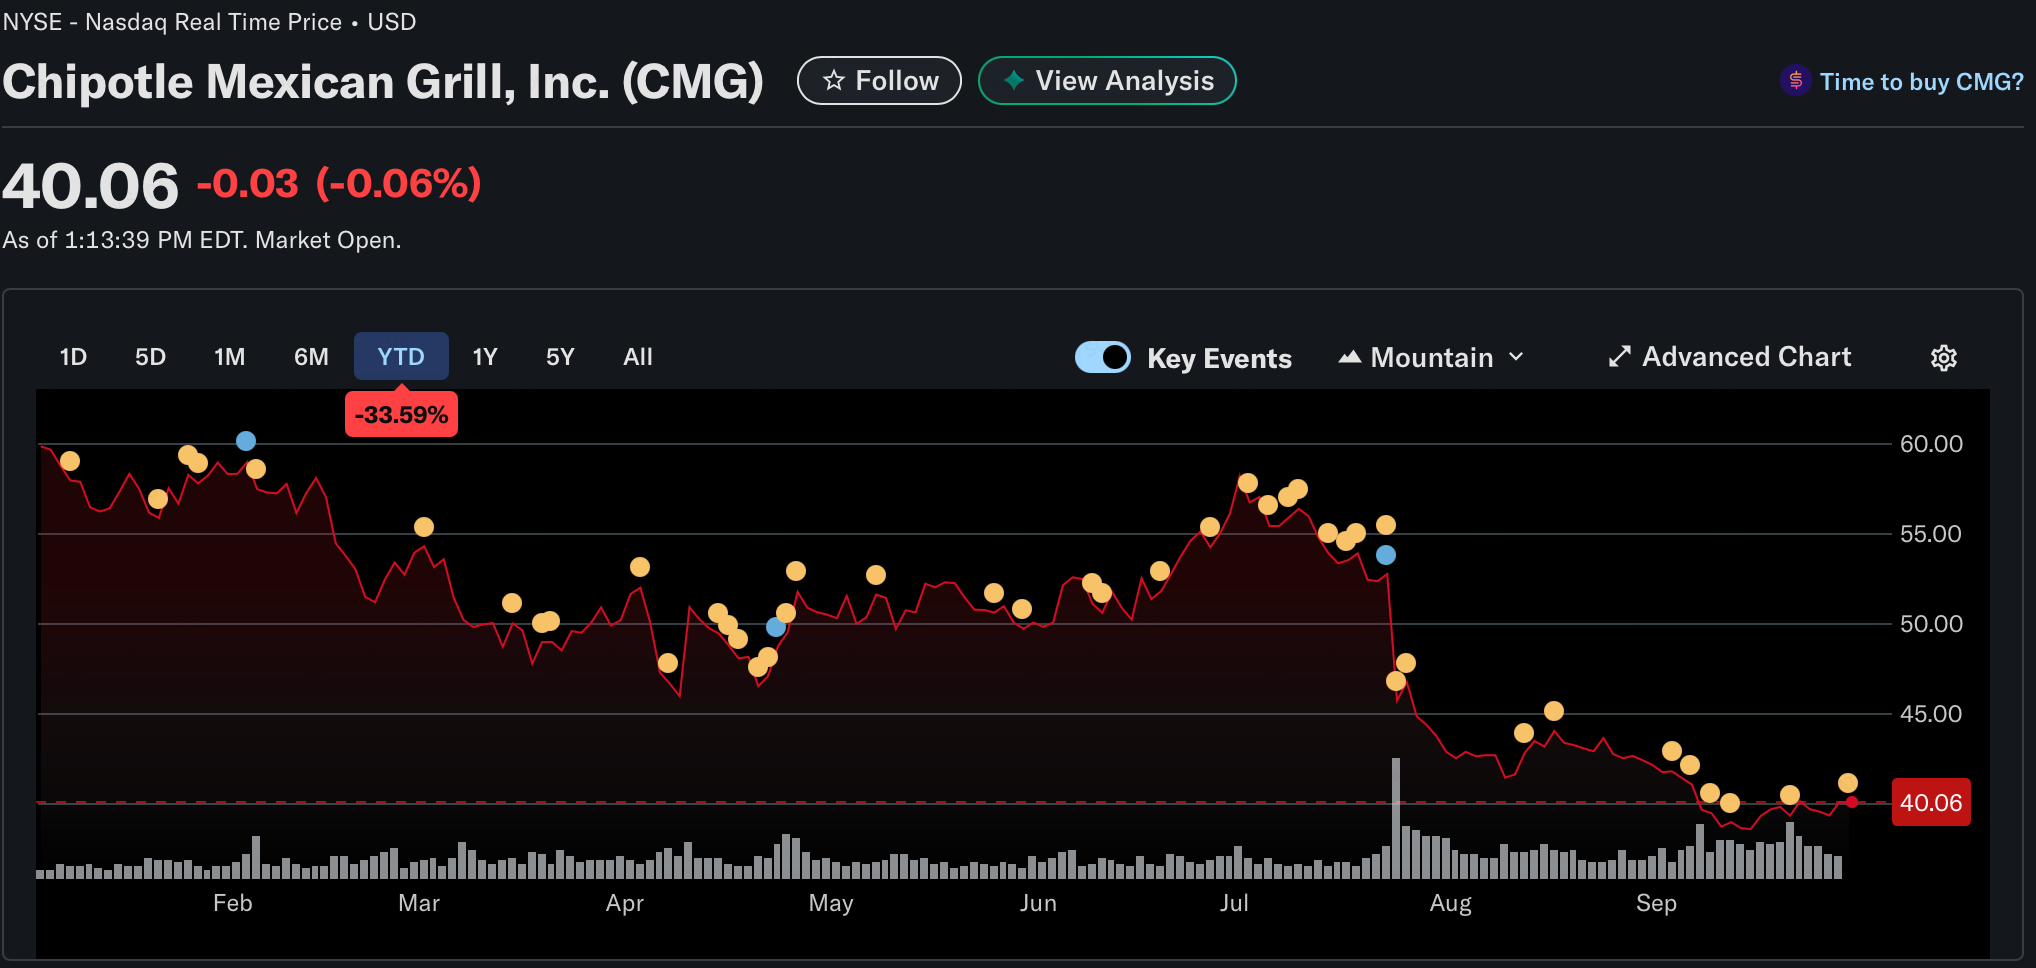
Chipotle stock has taken a hit! Why?

Business Intelligence and Competitive Analysis
1. Industry analysis: Assess industry potential and risk by concentration & competition intensity, industry trend, value chain analysis.
2. Competitive positioning: position a company in the competitive landscape by profit comparison, enterprise ranking, KPI examination.
3. Enterprise diagnosis: discover problems and identify root causes by strengths and weaknesses, value drivers & breakdown analysis.

Key Questions

Industry Analysis
Concentration and Competition Intensity
How concentrated is the industry?

Concentration & Competition Intensity Summary
The US restaurant industry is highly concentrated and mature, with the largest chains dominating the total revenue pool, leaving Chipotle with a stable, yet minor, percentage of the overall market.
Despite its smaller revenue share, Chipotle is demonstrating rapidly increasing competitive efficiency by growing its portion of the industry’s total Operating Income (profits), showing stronger profitability relative to its peers from 2019–2024.
The high concentration means the environment is intensely competitive, and any market slowdown immediately pressures growth. This is evident in recent stock volatility, as maintaining new store growth and driving same-store sales are critical for justifying Chipotle’s premium valuation.

Industry Analysis
Trend Analysis
The potential and risk of the industry?

Industry Potential: Summary
Restaurants experienced highly volatile operating income with a sharp 2020 dip and recovery, while Food Retail income remained stable.
The Restaurant sector maintains a higher profitability (ROA), whereas Food Retail historically shows a slightly more conservative balance sheet with lower debt levels.
The highly concentrated Restaurant market features intense competition where top chains like Chipotle are strategically increasing their share of total operating income.
Food Retail demonstrates superior efficiency in generating revenue from its assets (Asset Turnover), unlike the more asset-intensive Restaurant business model.

Industry Risk: Summary
The industry is highly vulnerable to external economic or health shocks, evidenced by the severe and sudden decline in Operating Income around 2020.
Intense competitive pressure keeps profitability moderate, with the largest group of analyzed companies clustering in the 10-15% Net Margin range.
The sector operates with higher financial leverage risk, maintaining a consistently higher Median Liability to Asset Ratio compared to the Food Retail industry.

Industry Analysis
Value Chain & Industry Comparison
Expand or stay focused?
More valuable and better potential Industries - how to measure?
Gross margin: value added
Size, profitability, productivity and growth

Value Chain & Industry Comparison: Summary
The Restaurant industry faces a high vulnerability to external shocks, as demonstrated by the sharp 2020 plunge in its Total Operating and Net Income.
The sector carries higher financial leverage risk than Food Retail, evidenced by its consistently higher Median Liability to Asset Ratio.
Despite high median profit margins, competitive risk is concentrated, with the overall profitability dominated by a few large enterprises like McDonald's (MCD) that achieve outsized Net Margins (over 30%).

Competition Positioning
Profit Comparison
Where do I stand in the competition landscape?

Profit Comparison: Summary
The restaurant companies display a wide range of financial performance, with MCD and SBUX being the largest in Total Revenue and Operating Income (absolute profit).
While these giants show moderate Return on Assets (ROA), smaller companies like DPZ achieve the highest ROA, demonstrating superior profit generation efficiency relative to their asset base.
Overall, the charts illustrate a trade-off where the largest firms prioritize massive scale while other strong performers focus on optimizing asset returns.

Competition Positioning:
Multiple Rankings
Where is the company ranked relative to its competitors?

Competition Positioning
KPI Examination
Anomalies and potential issues undetected?

Ranking and KPI Examination: Summary
Based on the provided charts, Chipotle Mexican Grill, Inc. ranks fourth in both Total Revenue and Operating Margin among the selected peer group of six restaurant companies.
While Chipotle's overall profitability and operational efficiency metrics appear generally Normal or High when compared to industry percentiles, its Liability Asset Ratio is notably Low at , placing it at the 14th percentile.
This suggests Chipotle has a strong financial position with relatively low reliance on debt compared to its assets, even though its absolute revenue and operating margin lag behind industry leaders like Starbucks and McDonald's.

Enterprise Diagnosis:
My strengths and weaknesses?

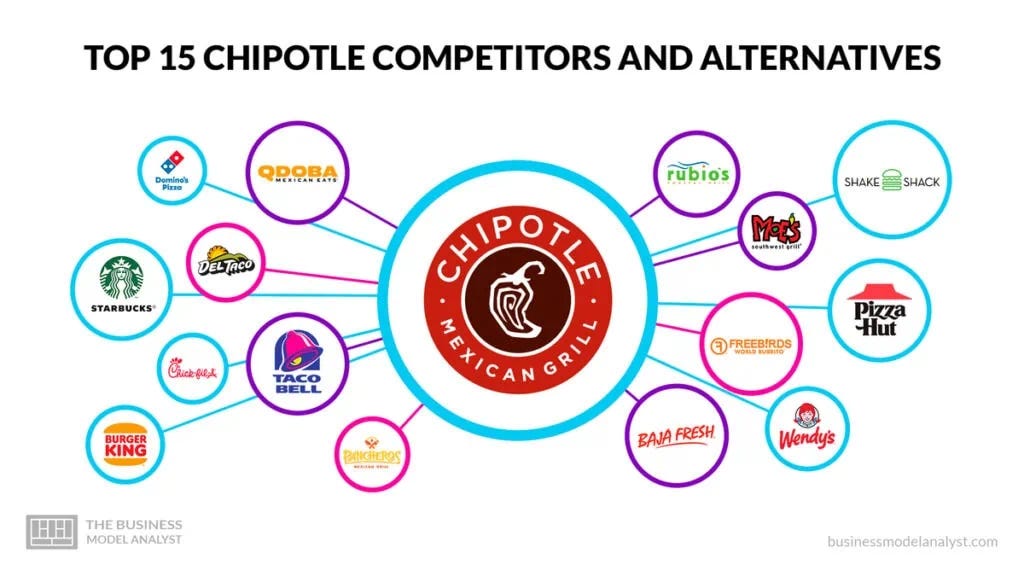
Major Competitors to Chipotle

Enterprise Diagnosis
Company trend

Strengths and Weaknesses: Summary
Efficiency Challenge: Labor productivity is consistently weaker than McDonald’s, meaning Chipotle generates less revenue per employee. This points to efficiency gaps in workforce utilization or higher labor intensity in its restaurant model.

Value Driver Analysis
Performance drivers

Breakdown Analysis
Root Causes

Summary
Operating volatility remains a watch point. The restaurant sector’s sharp 2020 dip and recovery highlight how quickly external shocks can disrupt earnings, making Chipotle’s results more sensitive to macro trends than steadier food retail peers.
Execution and expansion strategy are critical. Continued market-share gains will depend on Chipotle’s ability to scale efficiently without eroding margins, especially as rising costs and competitive intensity squeeze profitability across the industry.

Recap
Competitive intelligence and benchmarking
Industry analysis
Competition positioning
Enterprise diagnosis